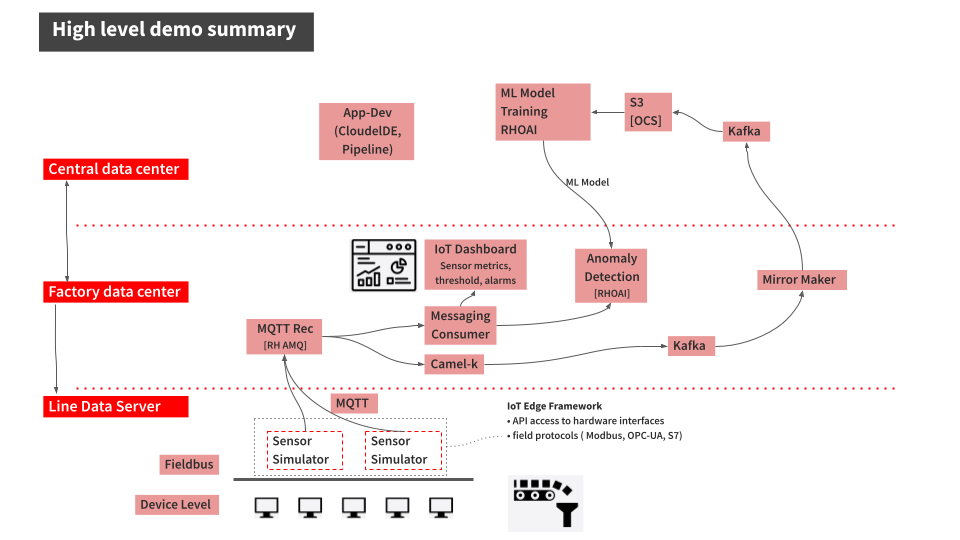
Demonstrating Industrial Edge example applications
Prerequisites
Ensure you have administrator access to the data center cluster using one of the following methods:
- The
kubeadminlogin credentials - The
kubeconfigfile (ensure the path is exported)
The steps followed so far should have successfully deployed the data center cluster, and optionally, a factory (edge) cluster.
With the infrastructure in place, it’s now time to see GitOps and DevOps in action through demonstrations that will modify both configuration data and deployed applications.
Configuration changes with GitOps
There might be times where you need to change the configuration of some of the edge devices in one or more of your factories. In our example, we have various sensors at the factory. Modification can be made to these sensors using
ConfigMaps.
Application changes using DevOps
The line-dashboard application has temperature sensors. In this demonstration you are going to make a simple change to that application, rebuild and redeploy
it.
Edit the file
components/iot-frontend/src/app/app.component.htmlin themanuela-devrepository there is a fileChange the
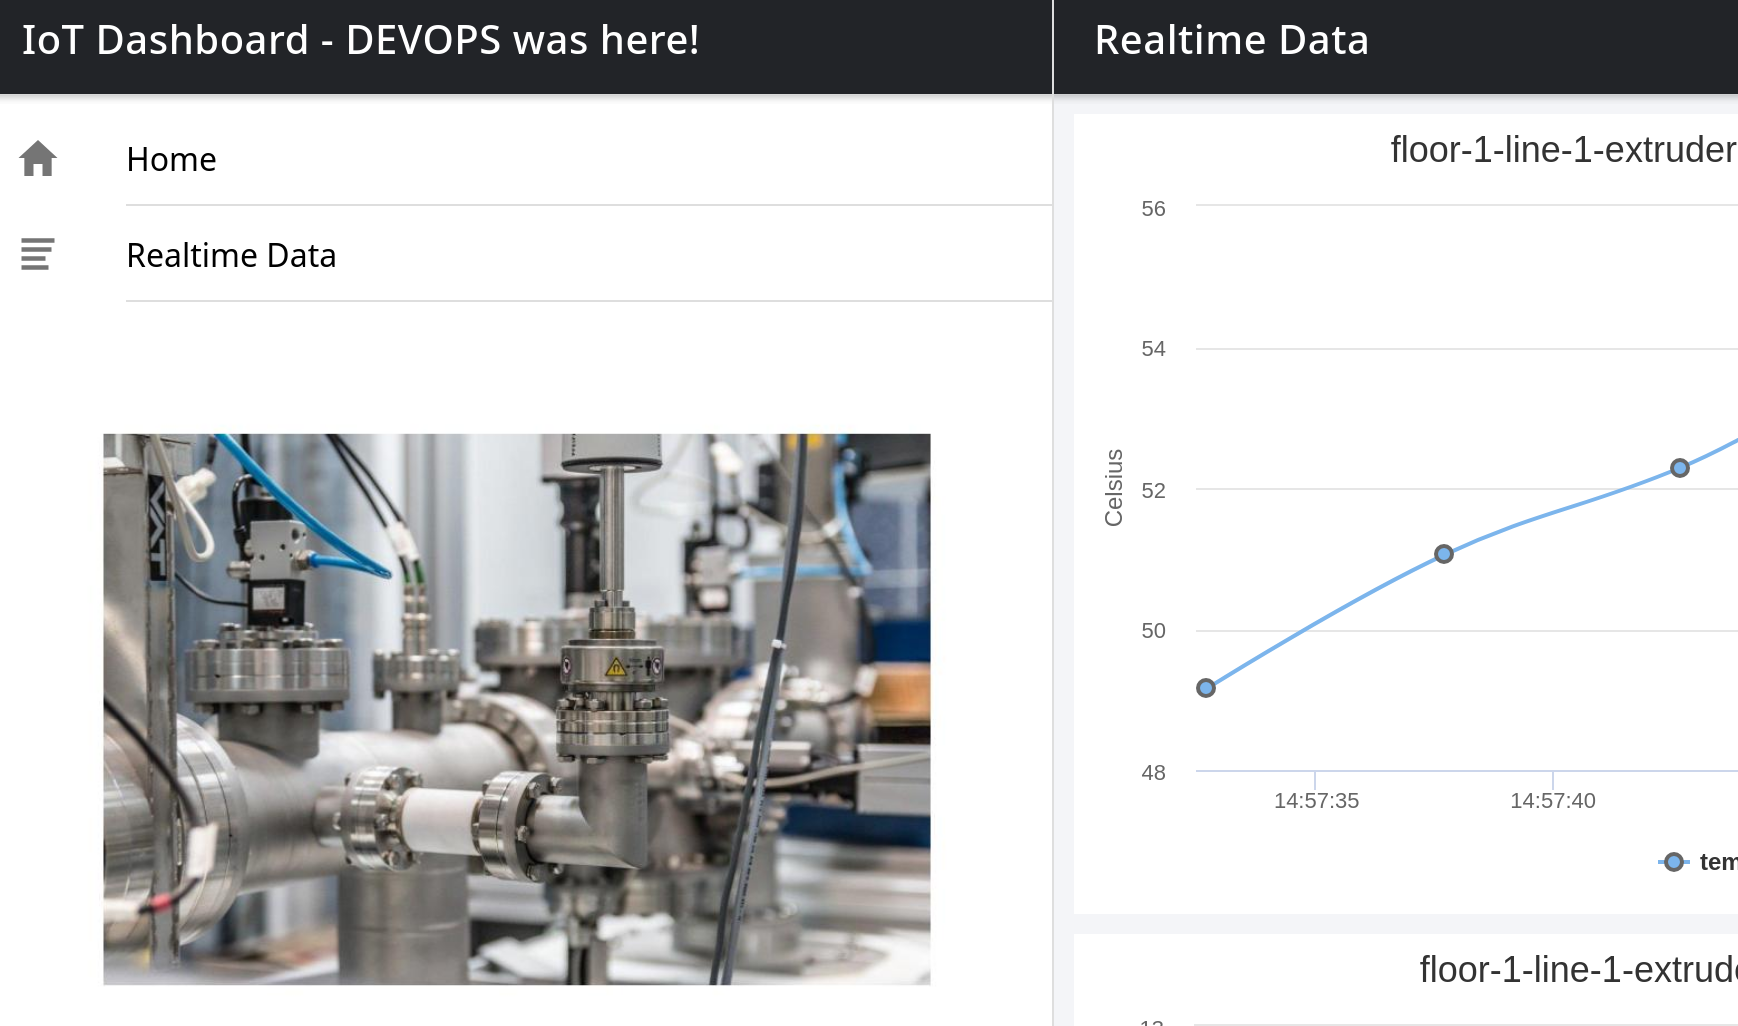
<ion-title>IoT Dashboard</ion-title>to for example,<ion-title>IoT Dashboard - DEVOPS was here!</ion-title>. Do this in the gitea web interface directly clicking on the editing icon for the file: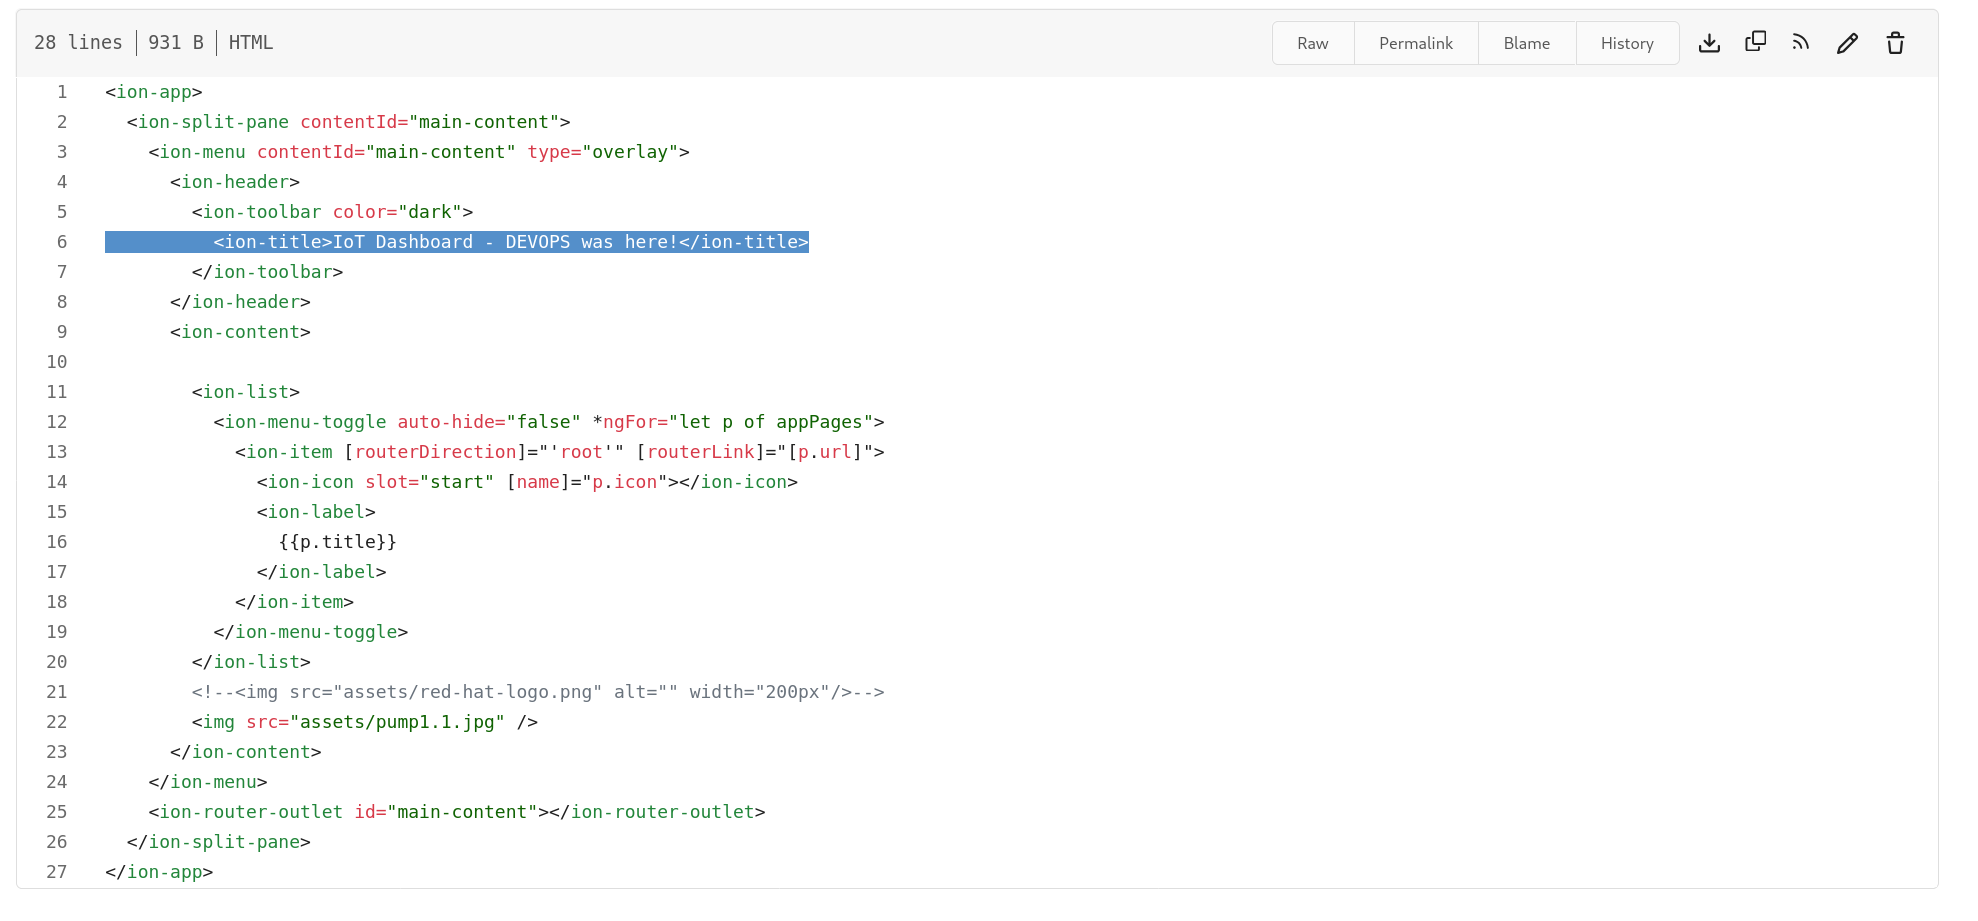
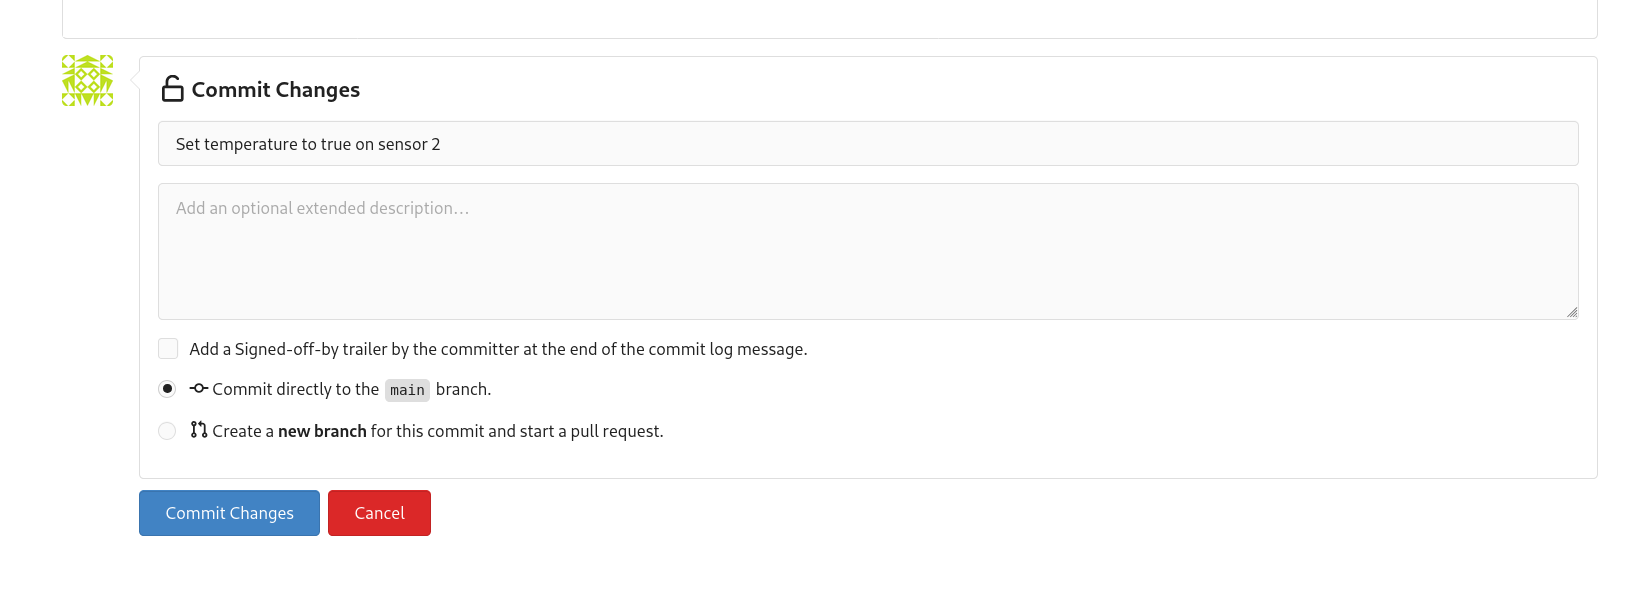
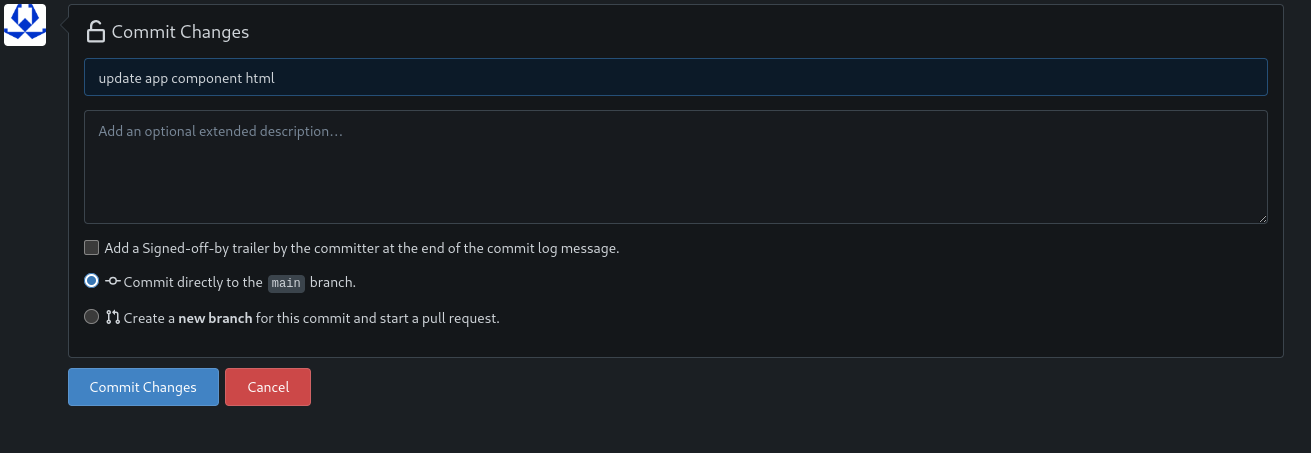
Commit this change to your git repository so that the change will be picked up by OpenShift GitOps (ArgoCD).
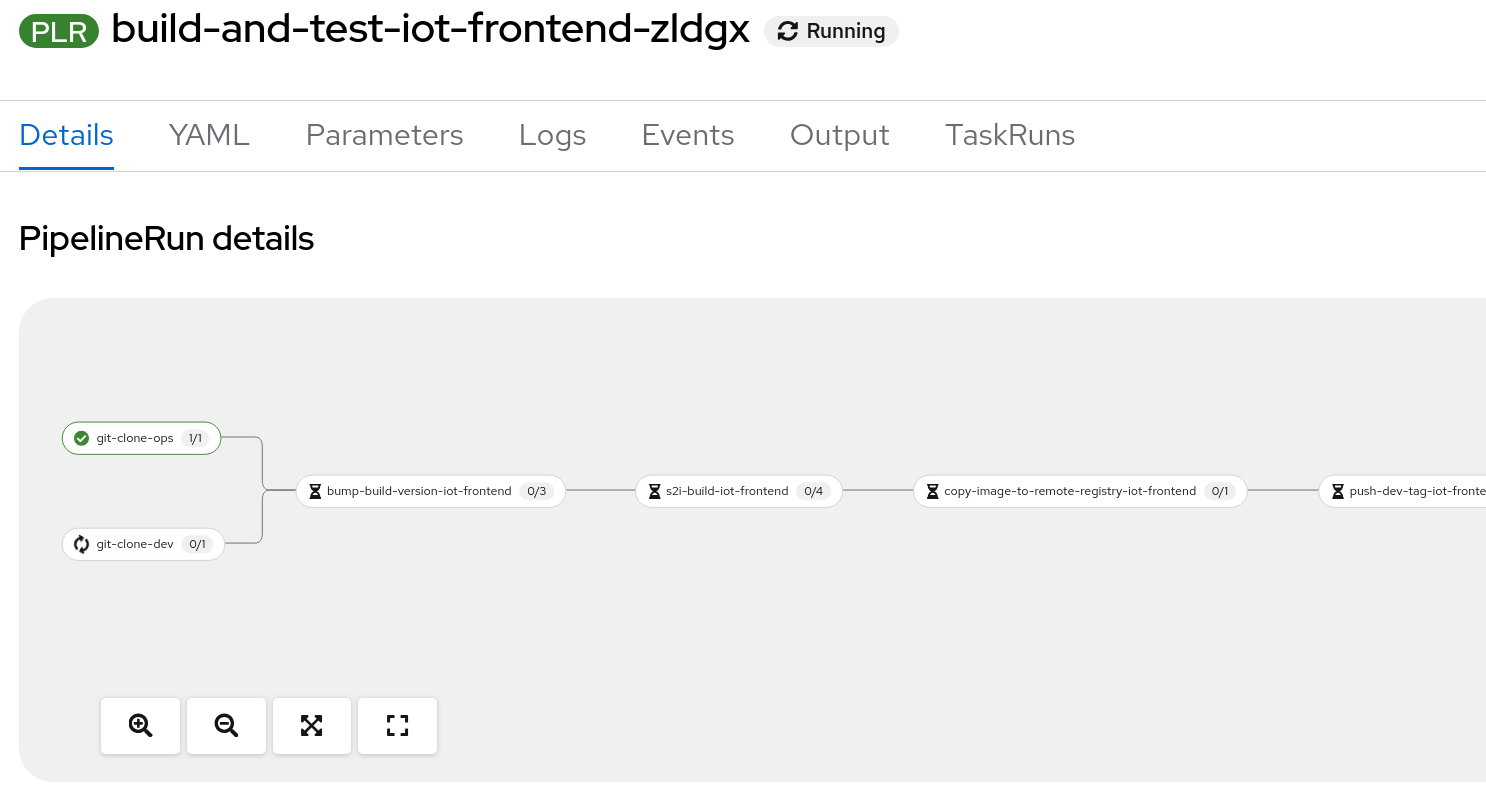
Start the pipeline called
build-and-test-iot-frontendthat will do the following:- Rebuild the image from the manuela-dev code
- Push the change on the hub datacenter in the manuela-tst-all namespace
- Create a PR in gitea
4.1 Start the pipeline by running the following command in
industrial-edgerepository:make build-and-test-iot-frontend
The pipeline will look a bit like the following:
After the pipeline completed the manuela-test application in Argo will eventually refresh and push the changes to the cluster and the line dash board route in the manuela-tst-all namespace will have picked up the changes. You might need to clear your browser cache to see the change:
The pipeline will also have created a PR in gitea, such as the following one:
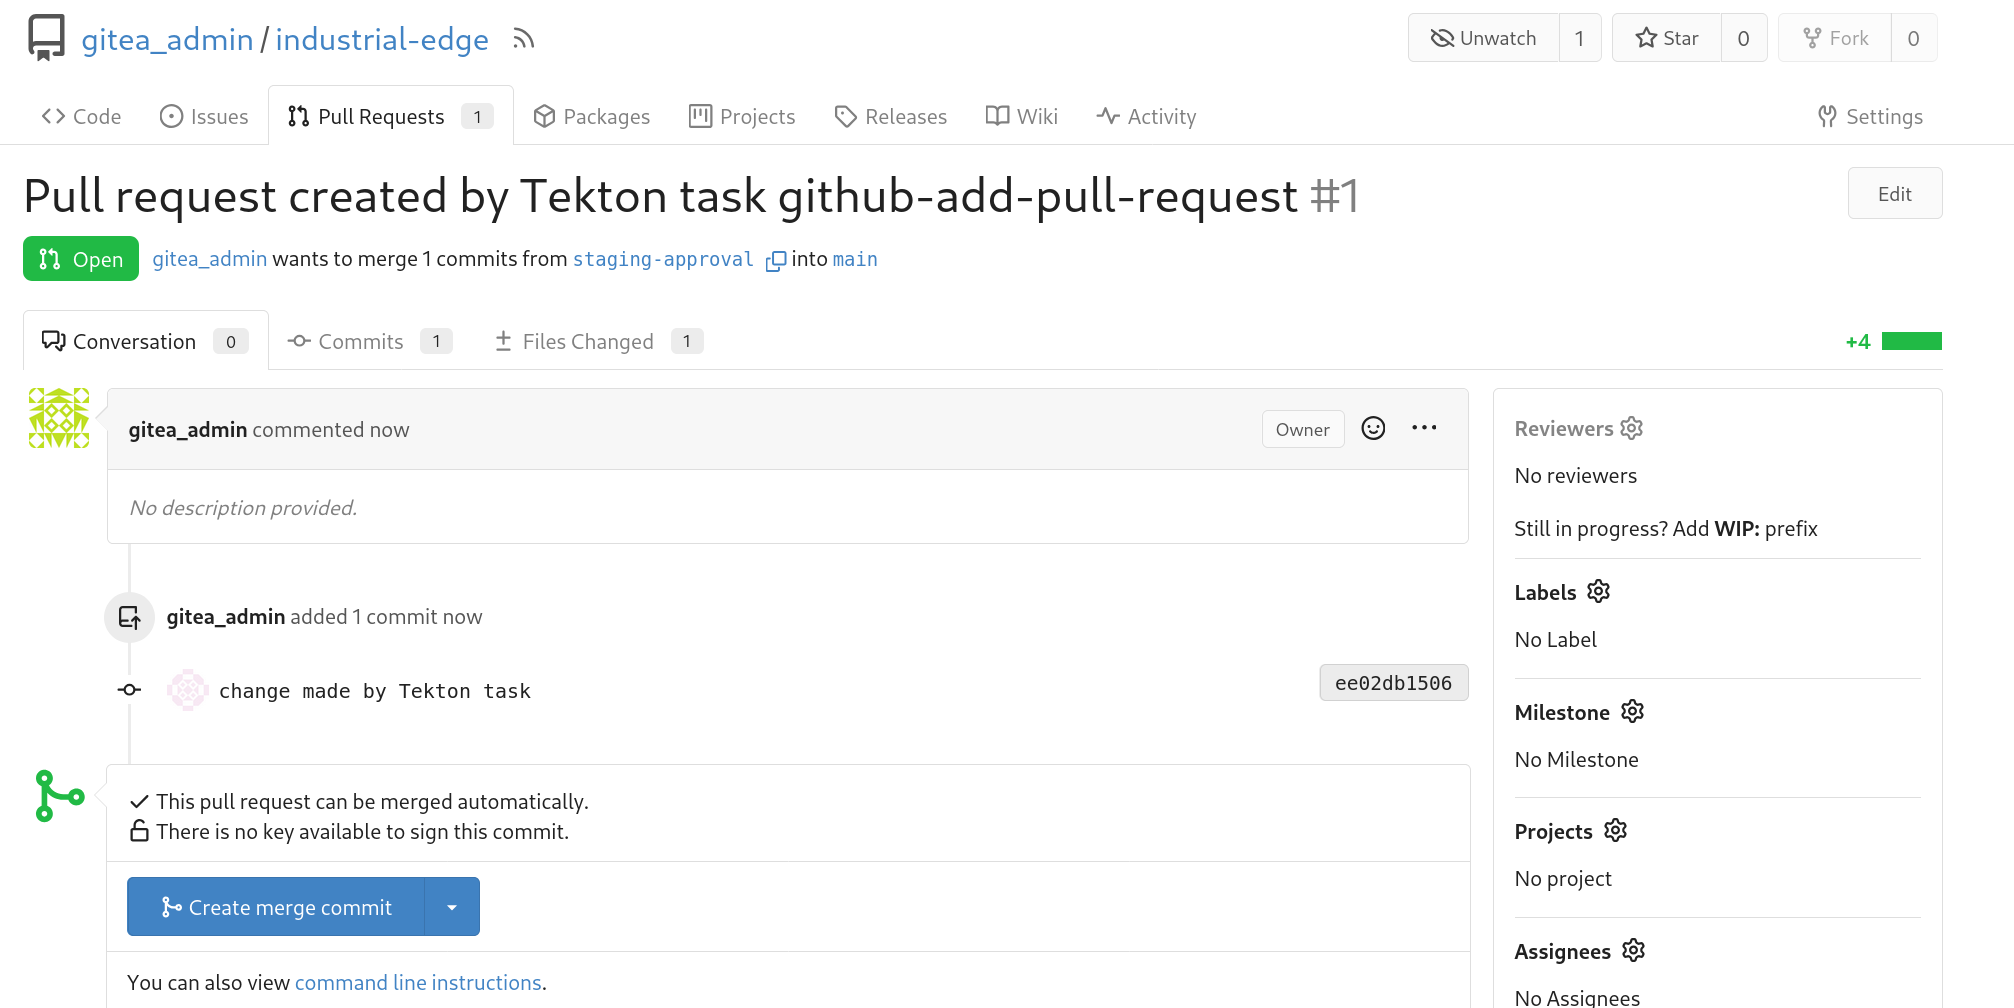
Verify that the change is correct on the datacenter in the manuela-tst-all line dashboard and if deemed correct, you can merge the PR in gitea which will roll out the change to the production factory!
AI model changes with MLOps
So far, we have looked at automating the deployment of changes to the application’s configuration and code. Let’s now explore how we can use OpenShift AI to automate the lifecycle of the application’s machine learning model, using similar means in terms of CI/CD and GitOps. For this, we’ll switch to the persona of a data scientist or ML engineer working on training and deploying the anomaly detection model.
Logging into the OpenShift AI workbench
On the OpenShift console click on the nine-box and choose
Red Hat OpenShift AI. You’ll be taken to the AI console which will look like the following: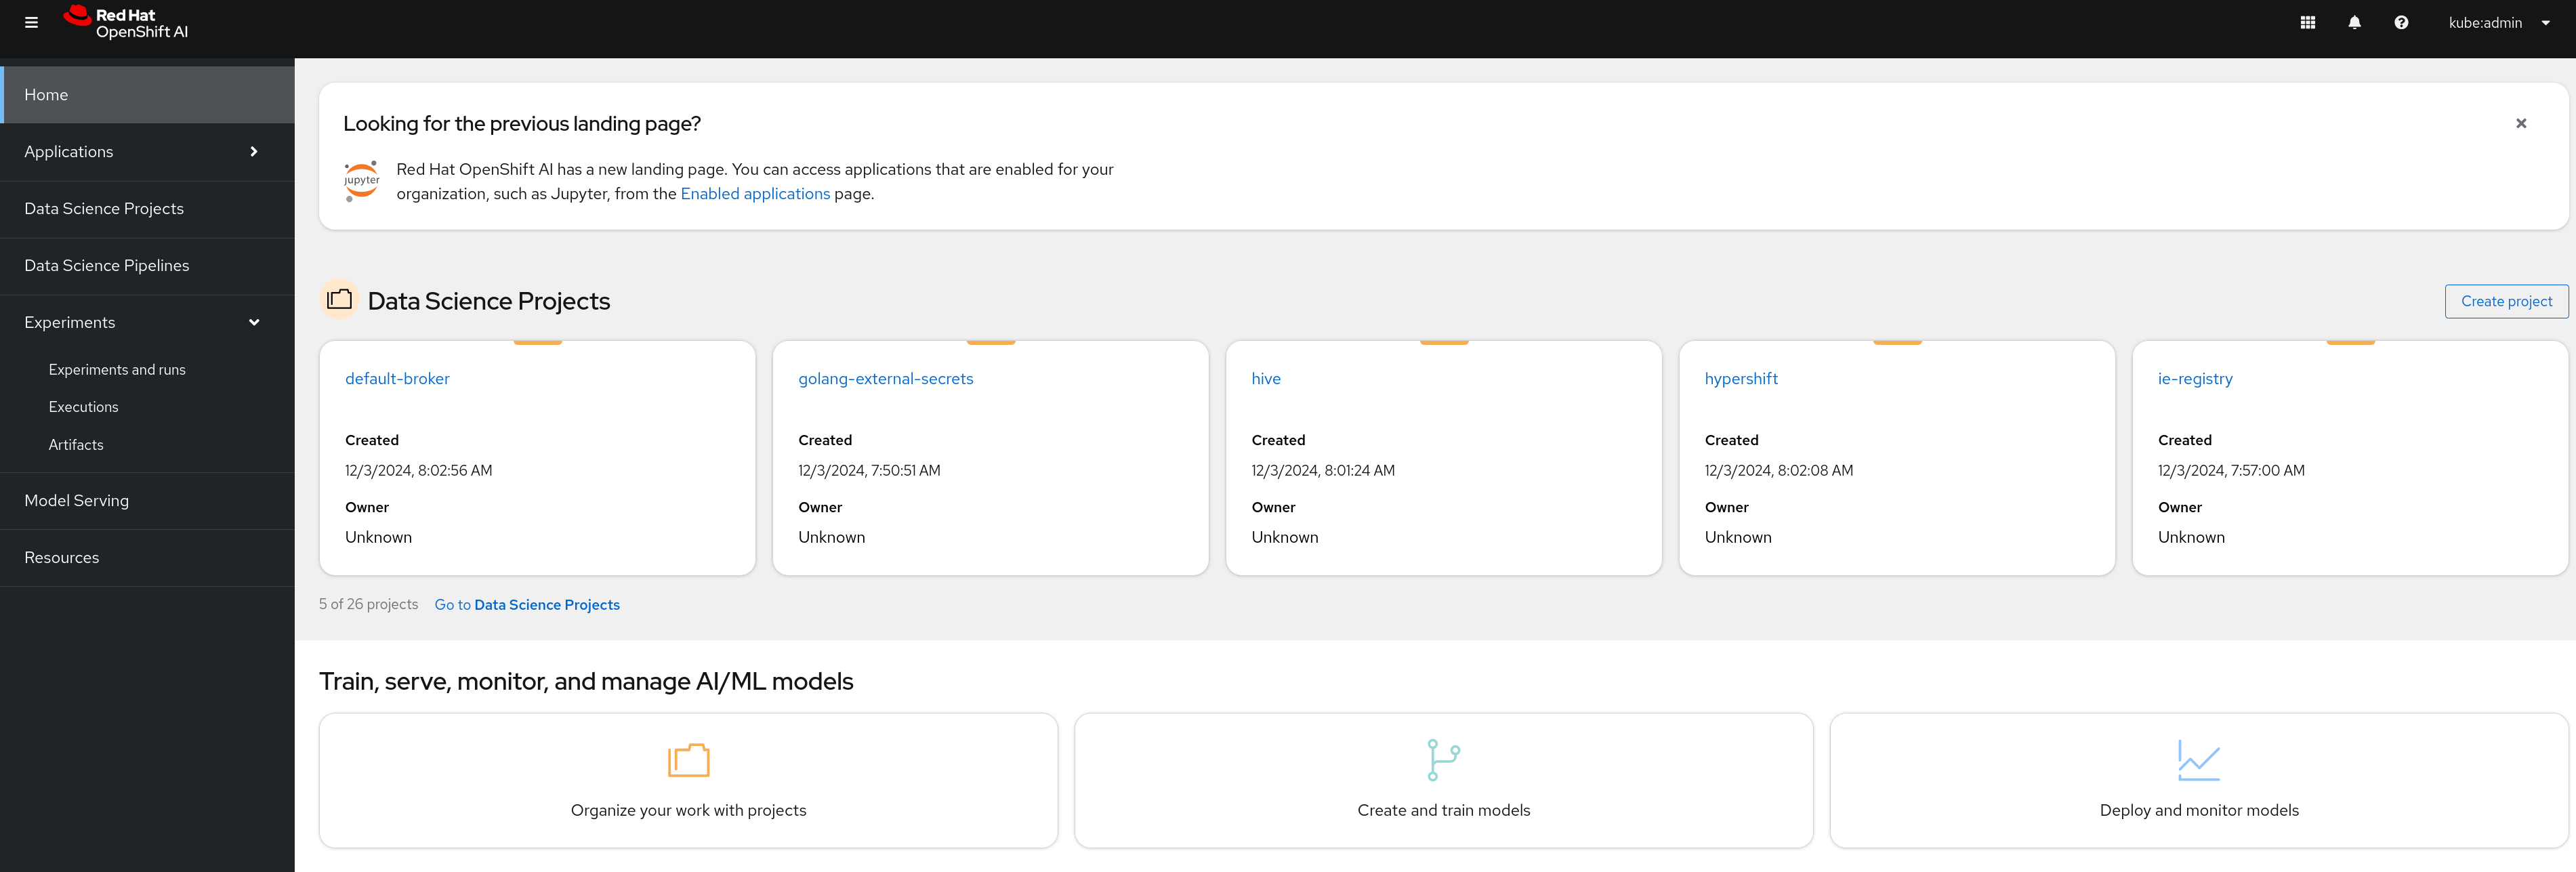
Click the
Data Science Projectson the left sidebar and choose theml-developmentproject. The project will open, containing a couple of workbenches and a model.: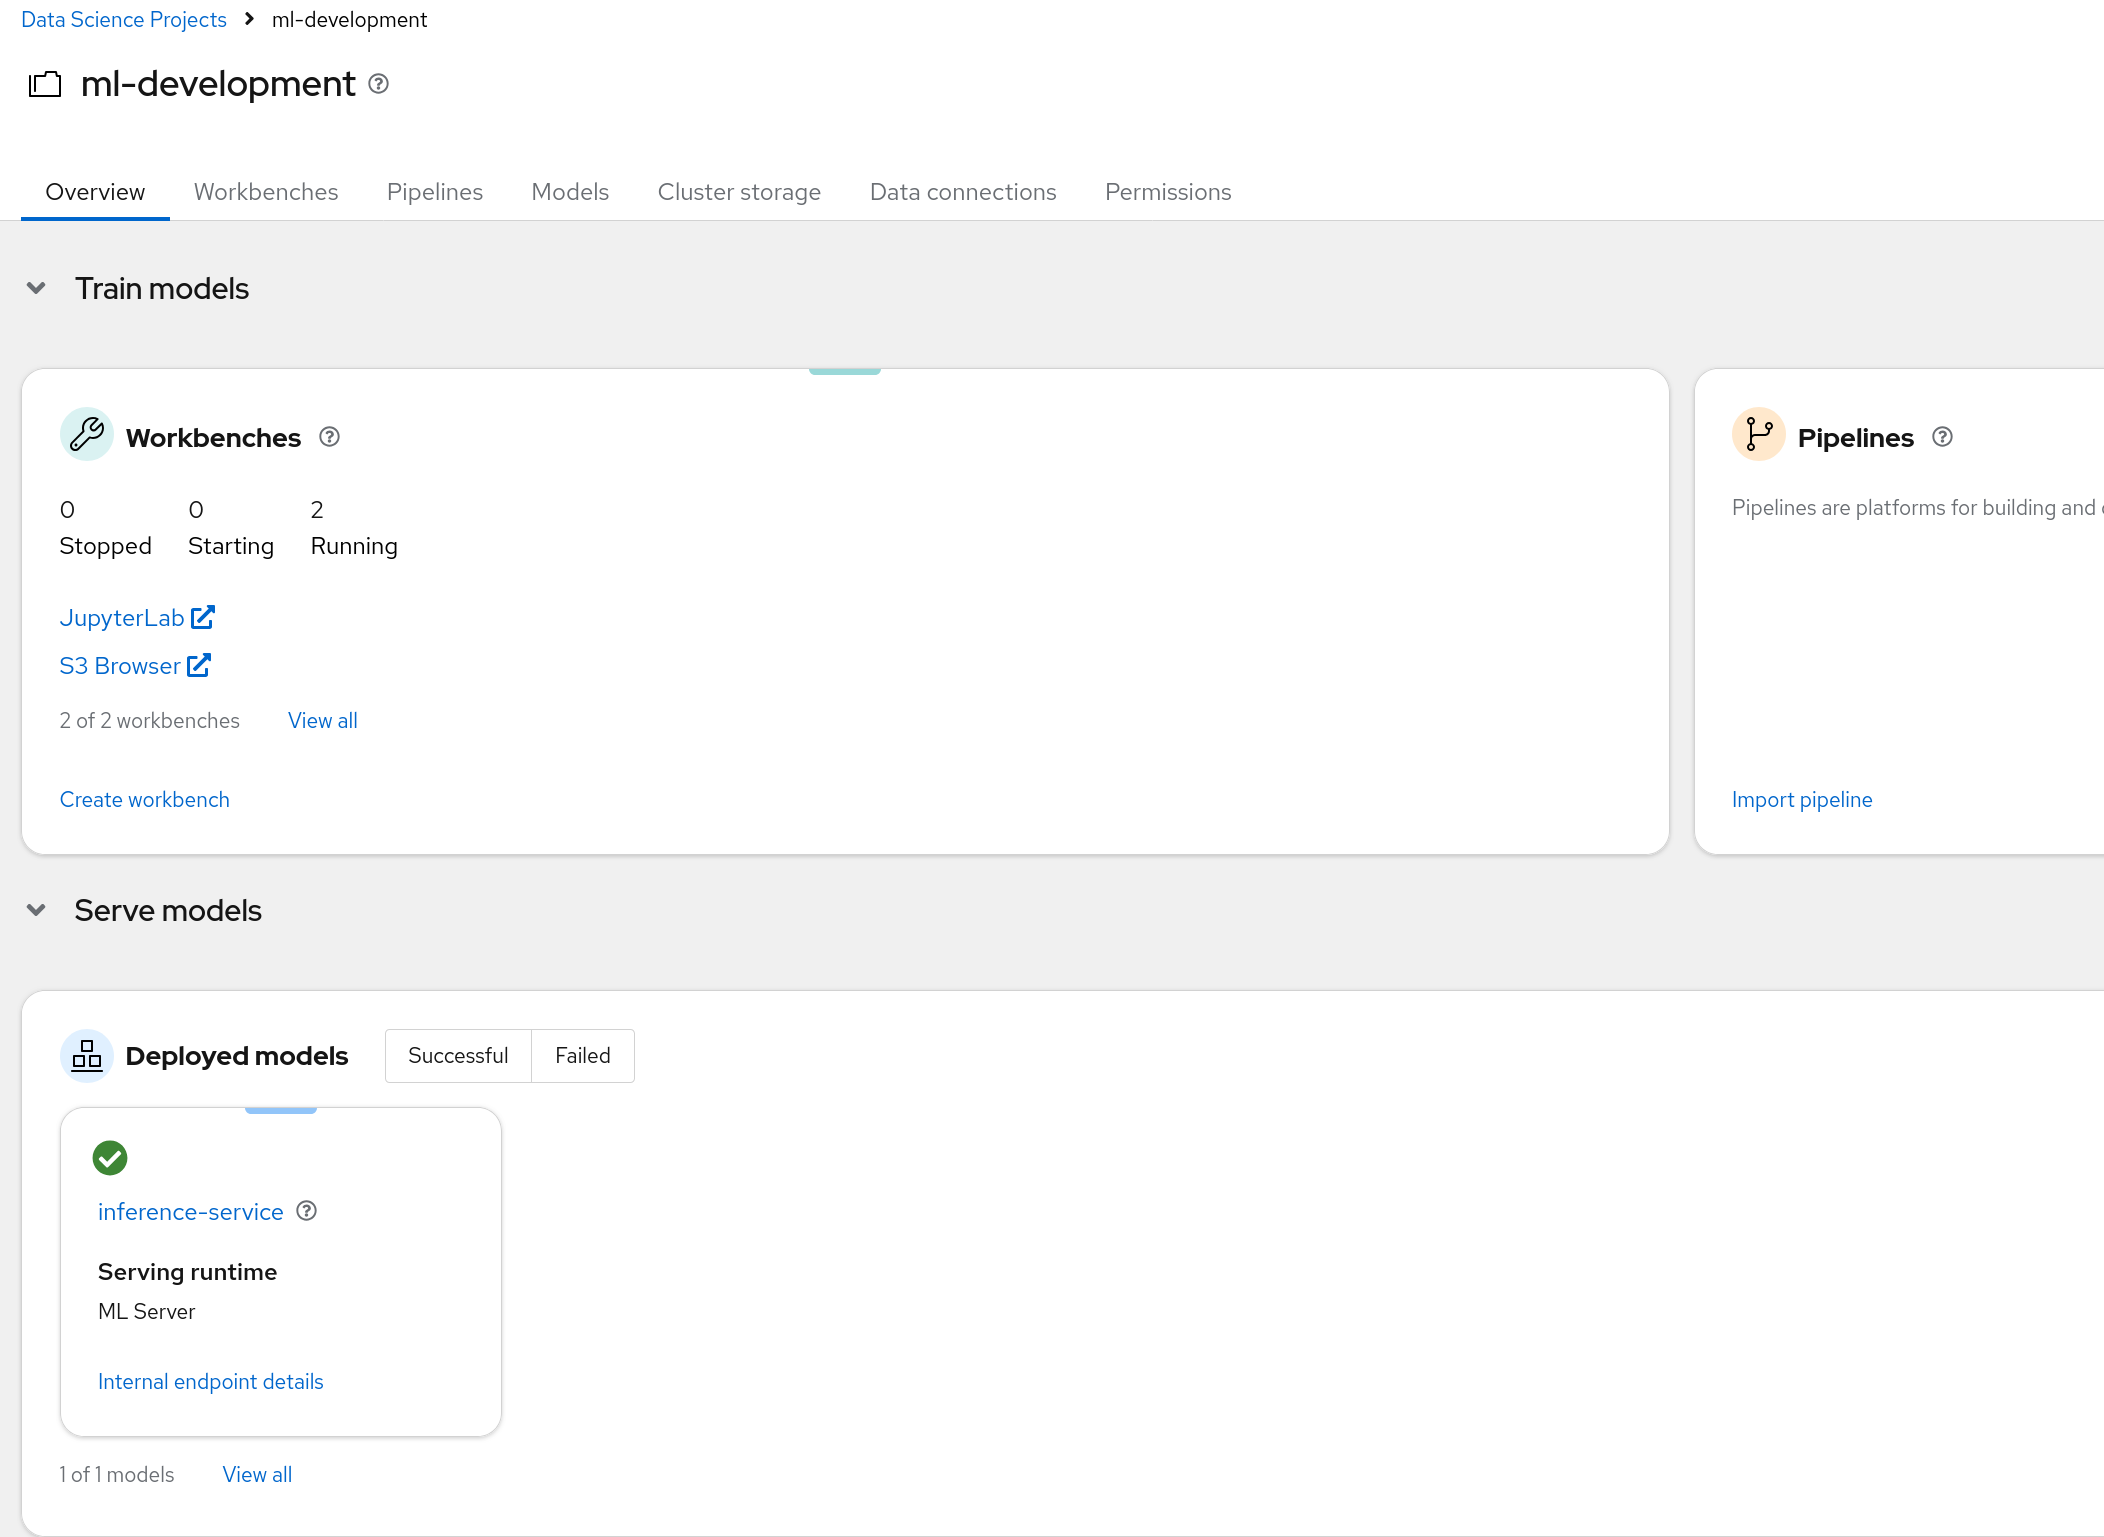
Clicking on the JupyterLab workbench you’ll be taken to the notebook where we can explore and analyze the machine data and prototype the code for training the anomaly detection model.
Interactive model development and staging
The manuela-dev code will be preloaded in the notebook and provide access to the Jupyter notebooks and Python modules that implement the model CI/CD steps. In the file browser on the left, navigate tomanuela-dev/ml-models/anomaly-detection/. You can double click on the Jupyter notebooks (.ipynb files) to see the code and the output of the notebooks:
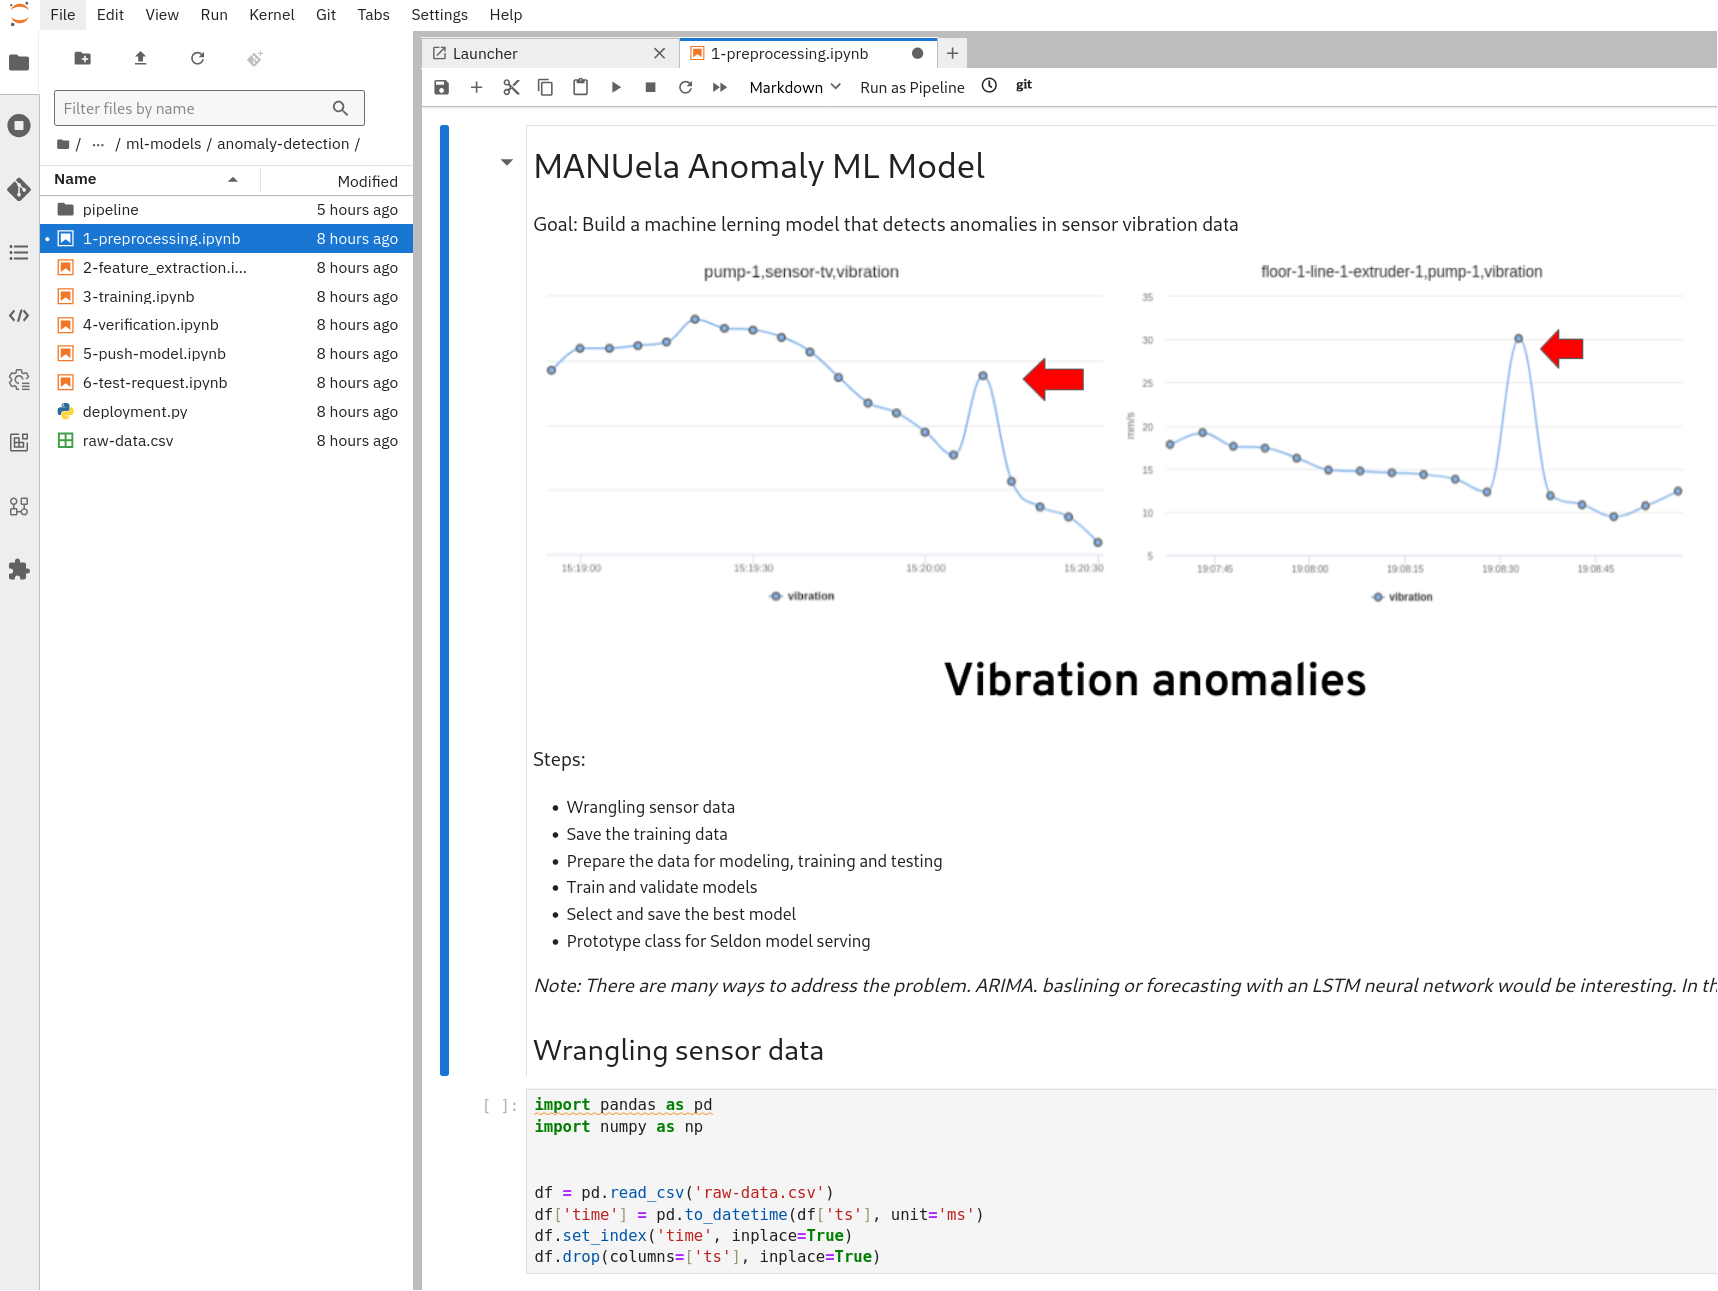
Notebooks are popular among data scientists for interactive data analysis and machine learning experiments. After opening the notebook, walk through the demonstration by pressing play and iterating through the commands in the playbook. Jupyter playbooks are interactive and you may make changes and also save those changes.
After opening the notebook successfully, walk through the demonstration by pressing play and iterating through the commands in the playbooks. Jupyter playbooks are interactive and you might make changes and also save those changes.
Running through all the six notebooks will automatically regenerate the anomaly model, prepare the data for the training and push the changes to the internal gitea so the inference service can pick up the new model.
Automated model CI/CD
Training machine learning models for production use cases usually involves ingesting large volumes of data and training for hours or longer. It’s a process that should be executed in an automated fashion for repeatability, scalability, observability, and auditability. And we may want to run this process on a pre-defined schedule, say once a week at a certain time. All of this calls for Pipelines!
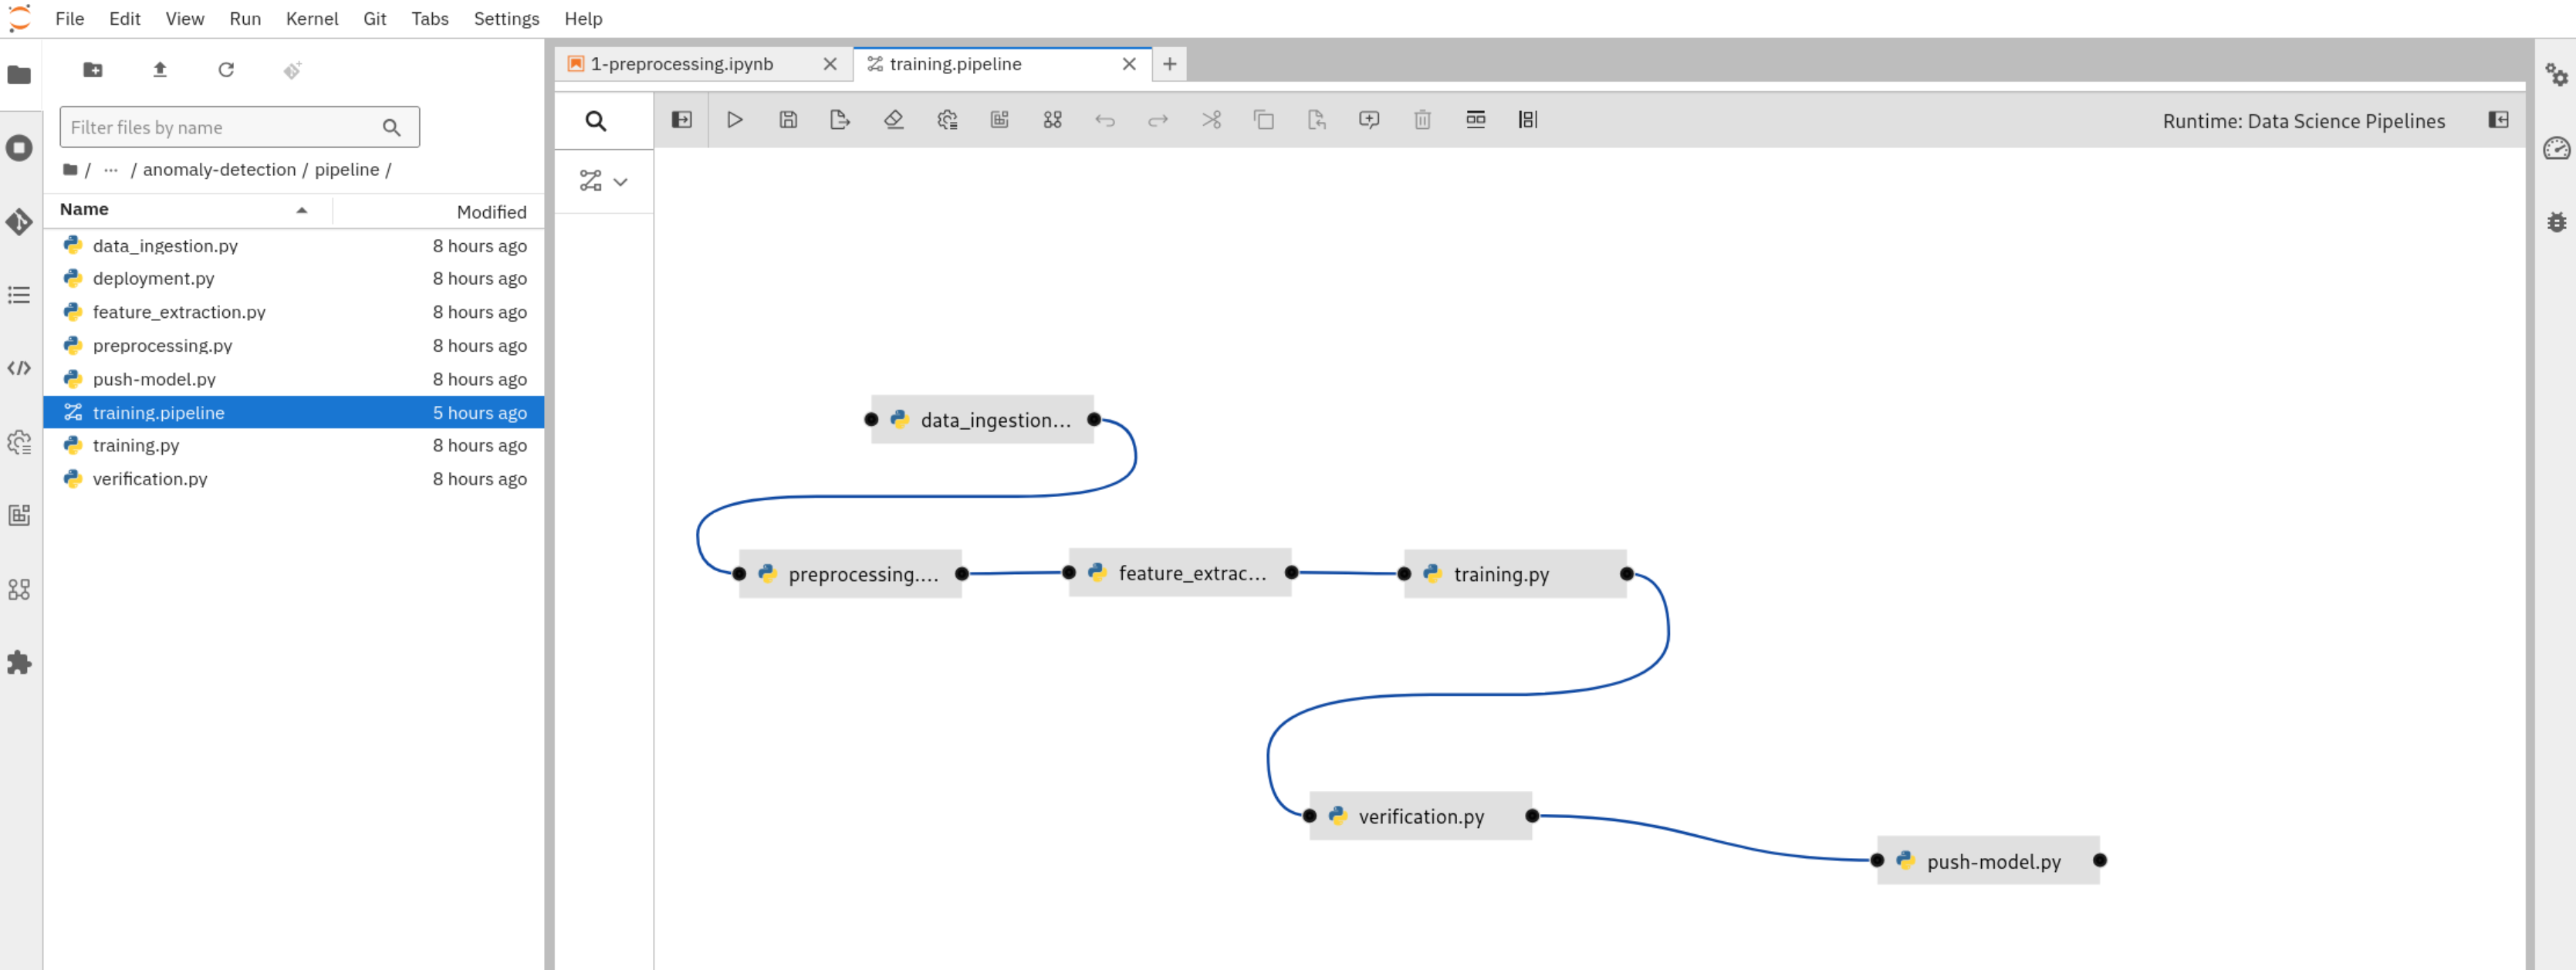
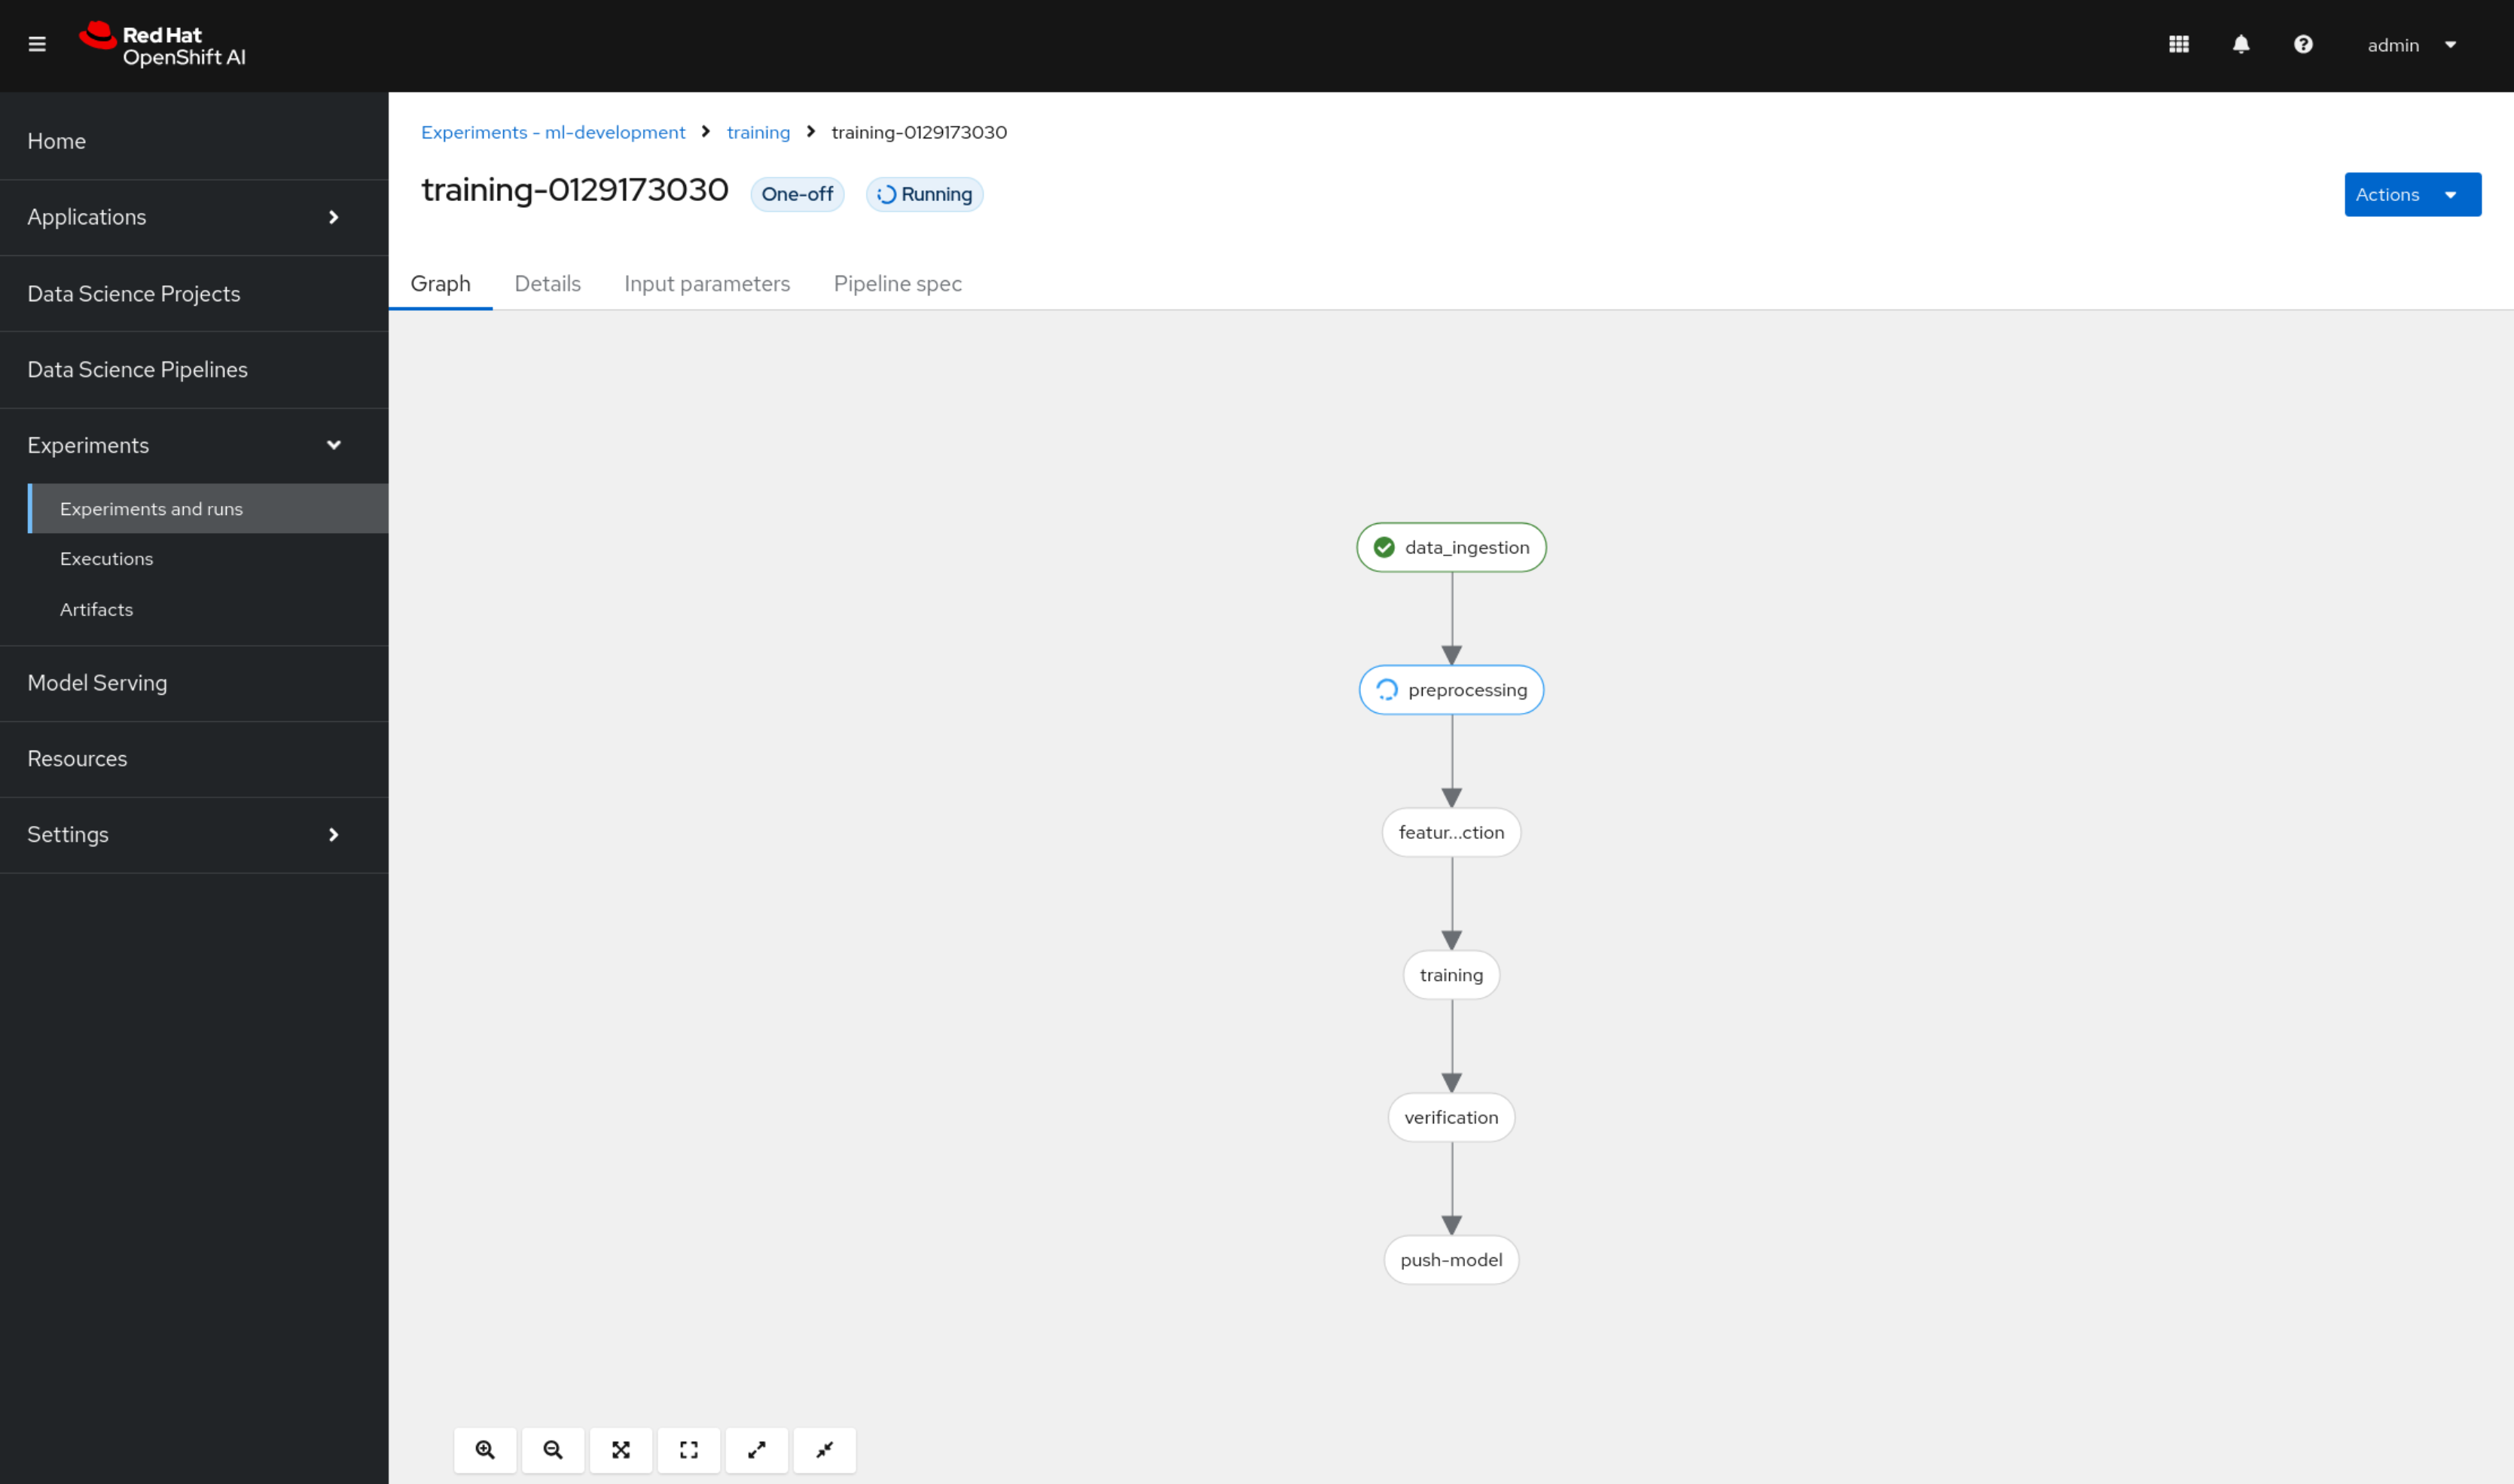
In the file browser on the left, open the pipelines folder. This folder contains Python modules corresponding to the Jupyter notebooks in the parent folder. These modules are intended to be run as scripts within the model CI/CD pipeline. The “gluing” of these steps into a proper pipeline is done within the Elyra pipeline definition file training.pipeline. Double clicking this file will open the Elyra pipeline editor and visualize the pipeline steps and their order of execution:
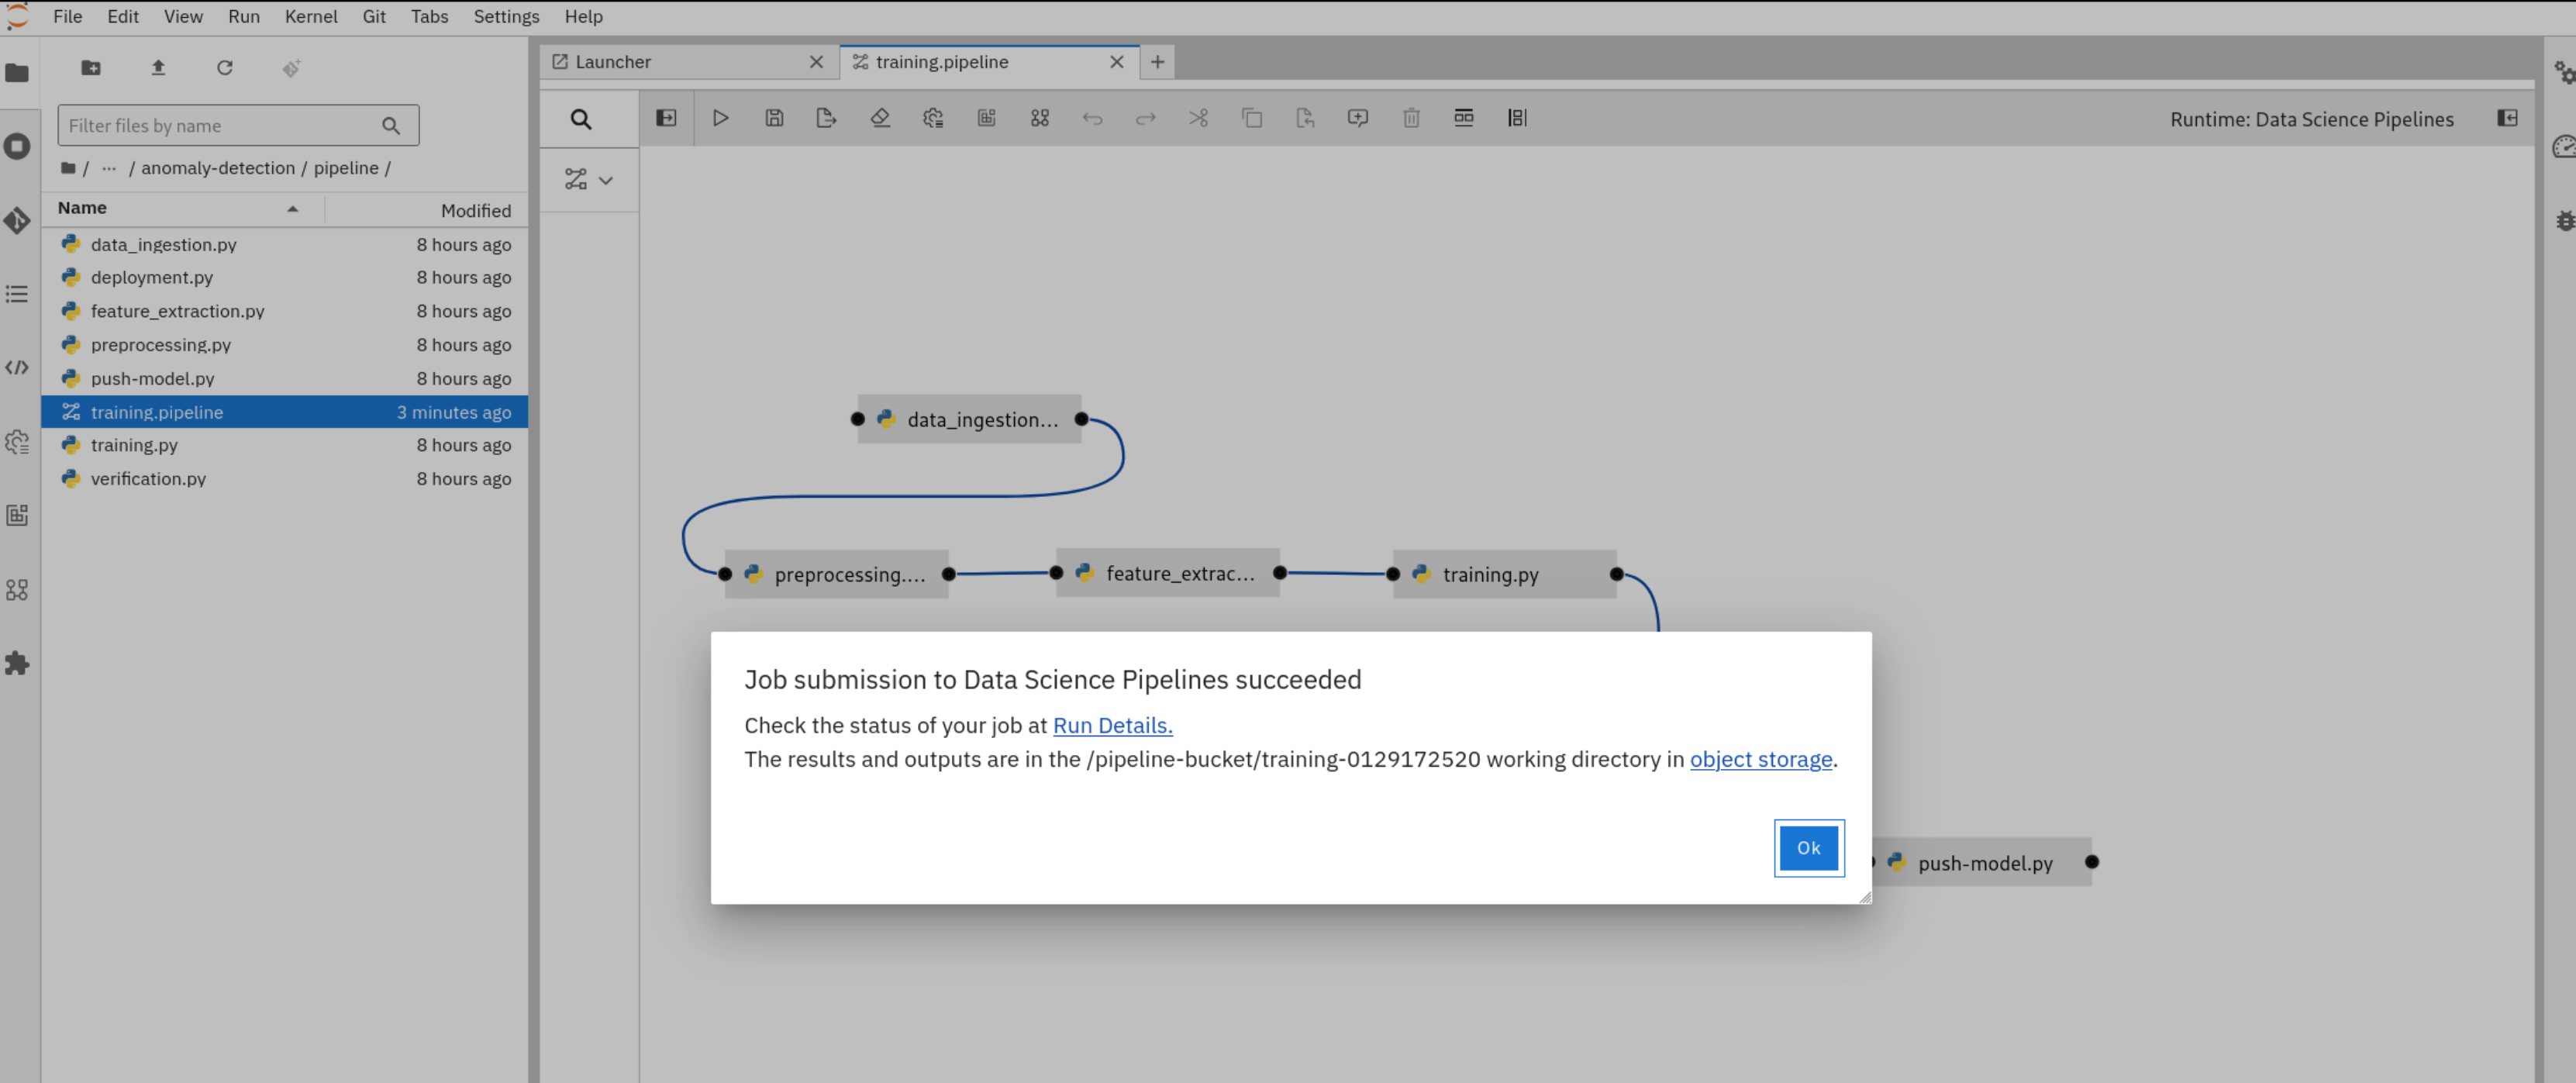
To submit the pipeline, select Run Pipeline (“play” icon in the top left corner of the Elyra editor). Select “Ok”, and view the confirmation message come up after just a few seconds. You can now navigate to the pipeline screen by selecting Run Details in the confirmation screen.
We’re now back in the OpenShift AI dashboard and can monitor the progress of our model CI/CD pipeline in real-time. You can select individual tasks to look up details such as pipeline logs, which helps to troubleshoot the pipeline code.
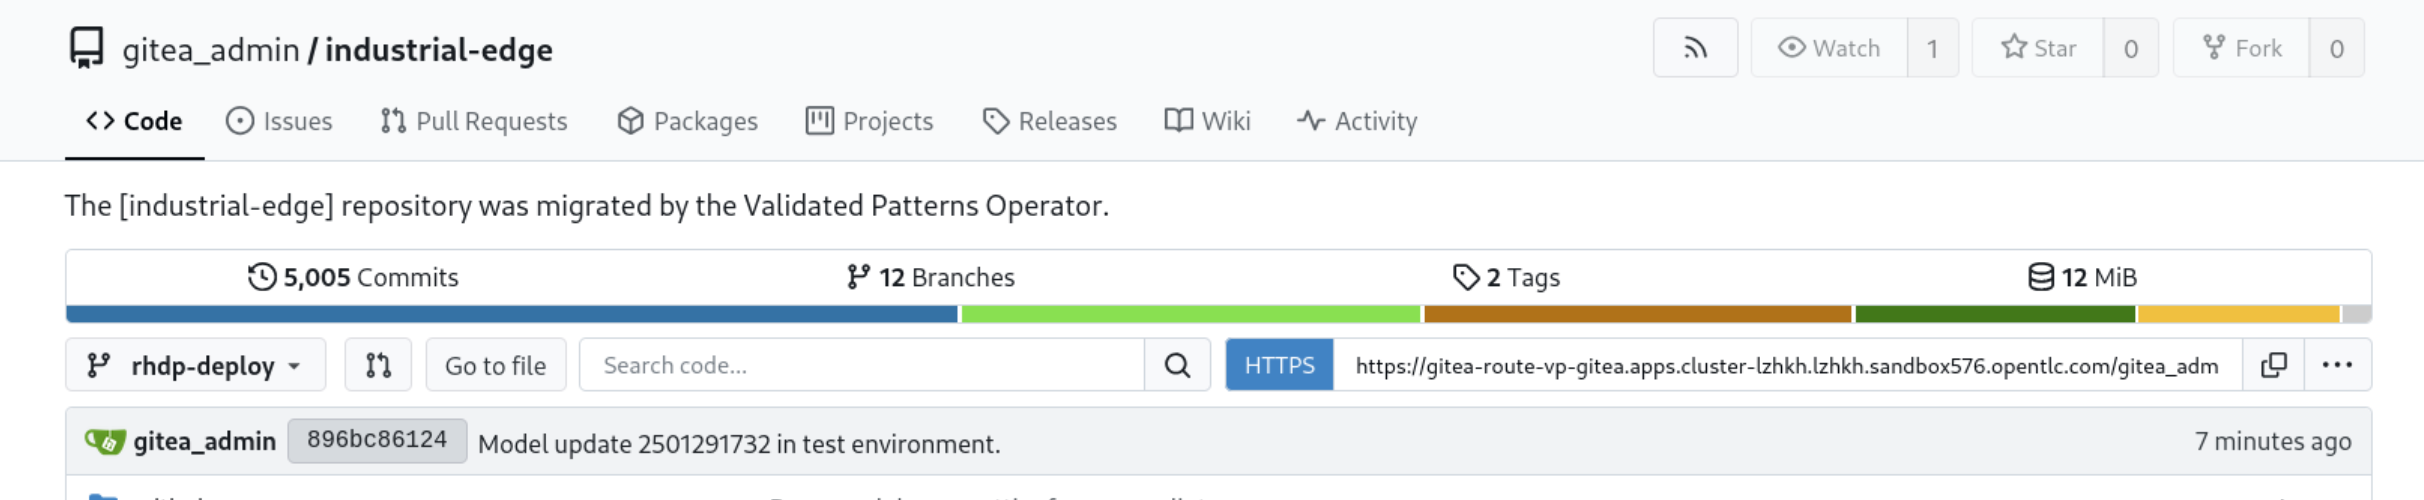
Once the pipeline has finished running, step over to Gitea and look up the industrial-edge repository (select rhdp-deploy branch if you’ve provisioned the pattern through RHDP). Notice the new commit indicating a model update in the test environment.
(to be continued…)