Ideas for Customization
Why change it?
One of the major goals of the Red Hat patterns development process is to create modular, customizable demos. The Industrial Edge demonstration includes multiple, simulated, IoT devices publishing their temperature and vibration telemetry to our data center and ultimately persisting the data into an AWS S3 storage service bucket which we call the Data Lake. All of this is done using our Red Hat certified products running on OpenShift.
This demo in particular can be customized in a number of ways that might be very interesting - and here are some starter ideas with some instructions on exactly what and where changes would need to be made in the pattern to accommodate those changes.
There are two environments in the Industrial Edge demonstration:
- The staging environment that lives in the manuela-tst-all namespace
- The production environment which lives in the stormshift namespaces
Enabling the temperature sensor for machine sensor 2
Our sensors have been configured to send data relating to the vibration of the devices. To show the power of GitOps, and keeping state in a git repository,
you can make a change to the config map of one of the sensors to detect and report data on temperature. This is done using a variable called *SENSOR_TEMPERATURE_ENABLED* that is initially set to false. Setting this variable to true will trigger the GitOps engine to synchronize the application, restart the machine sensor and apply the change.
As an operator you would first make changes to the staging first. Here are the steps to see how the GitOps engine does it’s magic. These changes will be reflected in the staging environment Line Dashboard UI in the manuela-tst-all namespace.
The config maps in question live in the
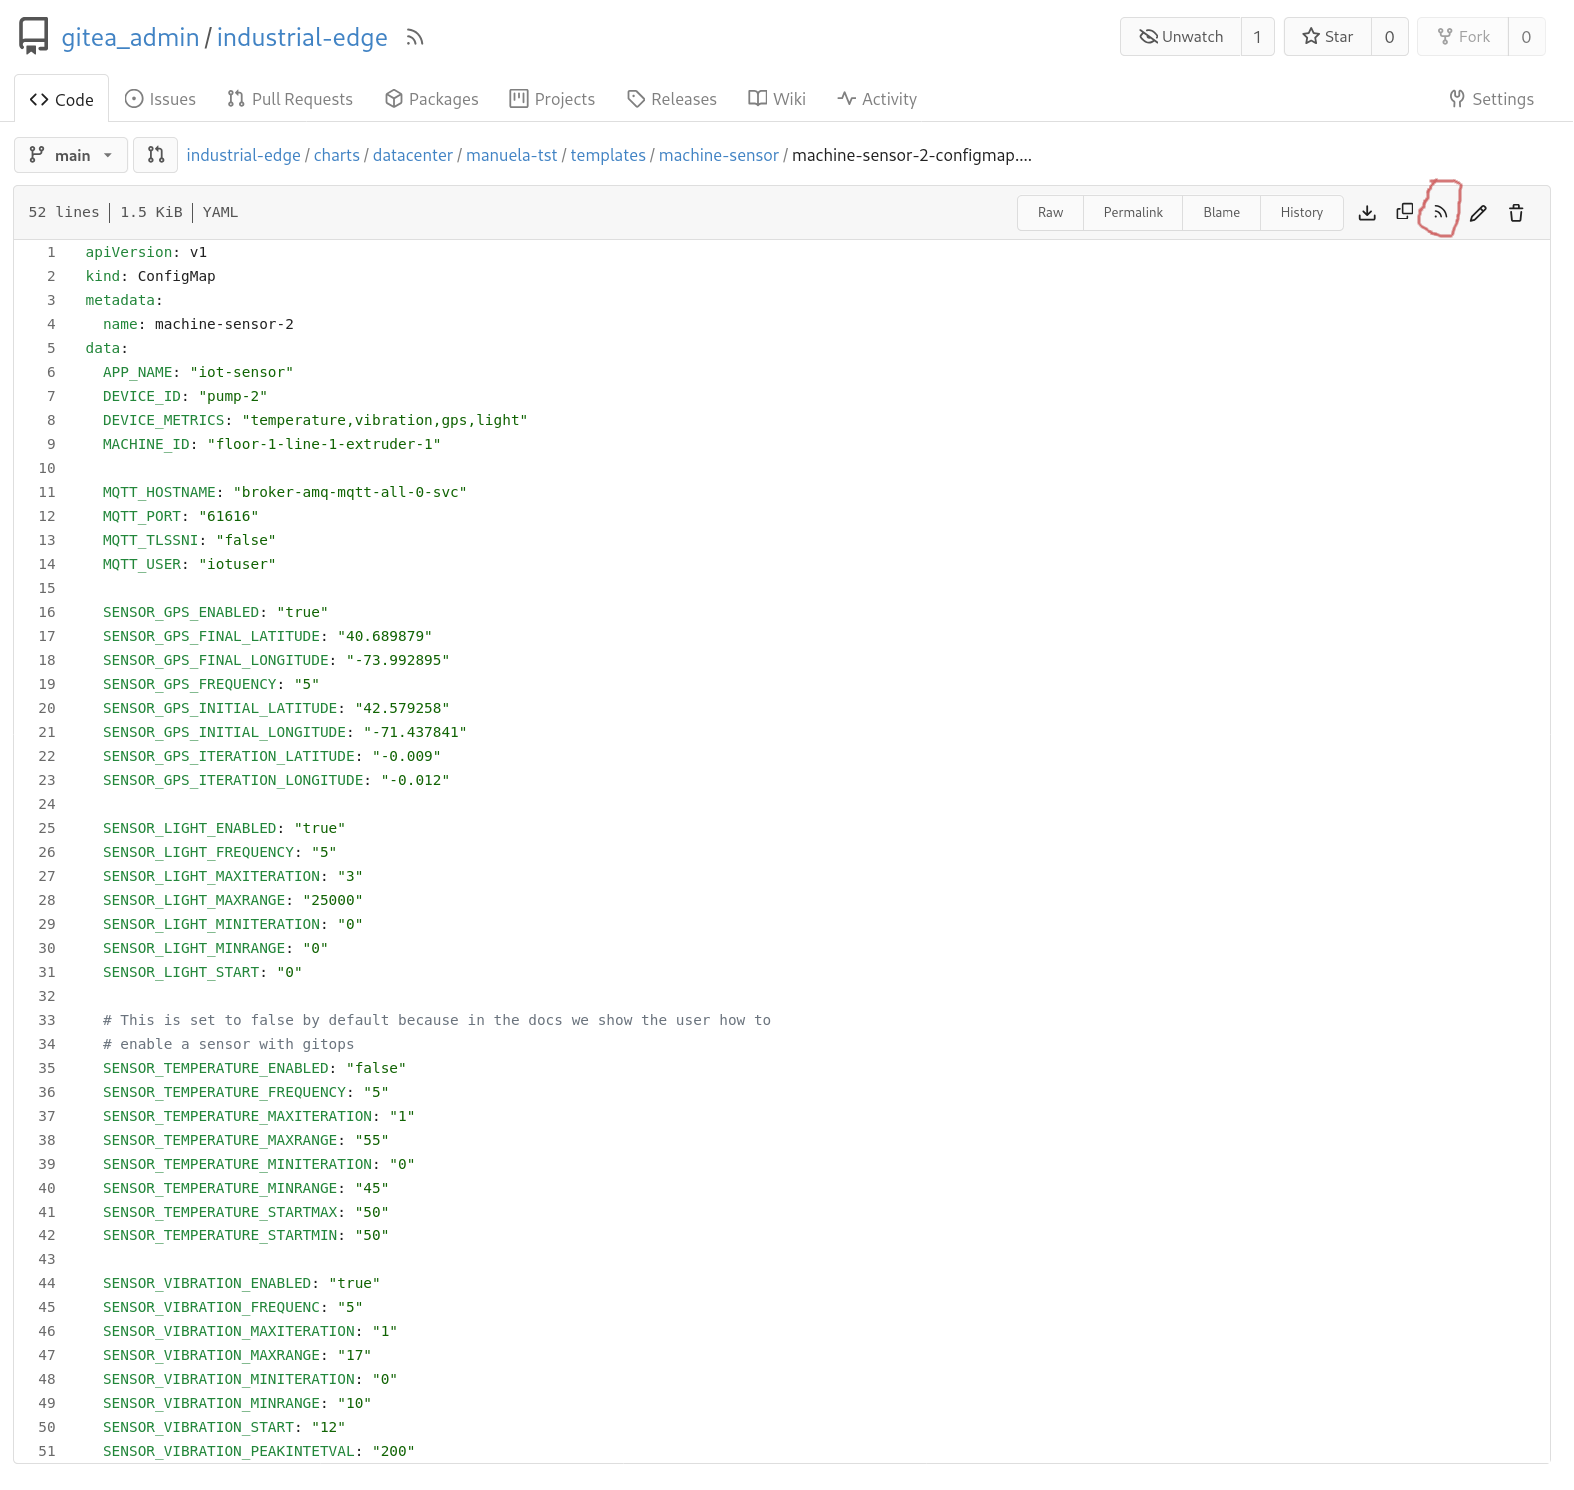
charts/datacenter/manuela-tst/templates/machine-sensordirectory:There are two config maps that you can change:
machine-sensor-1-configmap.yamlmachine-sensor-2-configmap.yaml
In this customization you will turn on a temperature sensor for sensor #2. Do this first in the data center because this will demonstrate the power of GitOps without having to involve the edge/factory cluster.
However, if you do have a factory joined using Advanced Cluster Management, then the changes will make their way out to the factory. But it is not necessary for the demo as we have a complete test environment on the data center.
Follow these steps in the OpenShift console to access the dashboard application in a tab on your browser:
Select Networking->Routes on the left-hand side of the console. Using the Projects pull-down, select
manuela-tst-all. The following screen appears:Click the URL under the Location column for the route Name
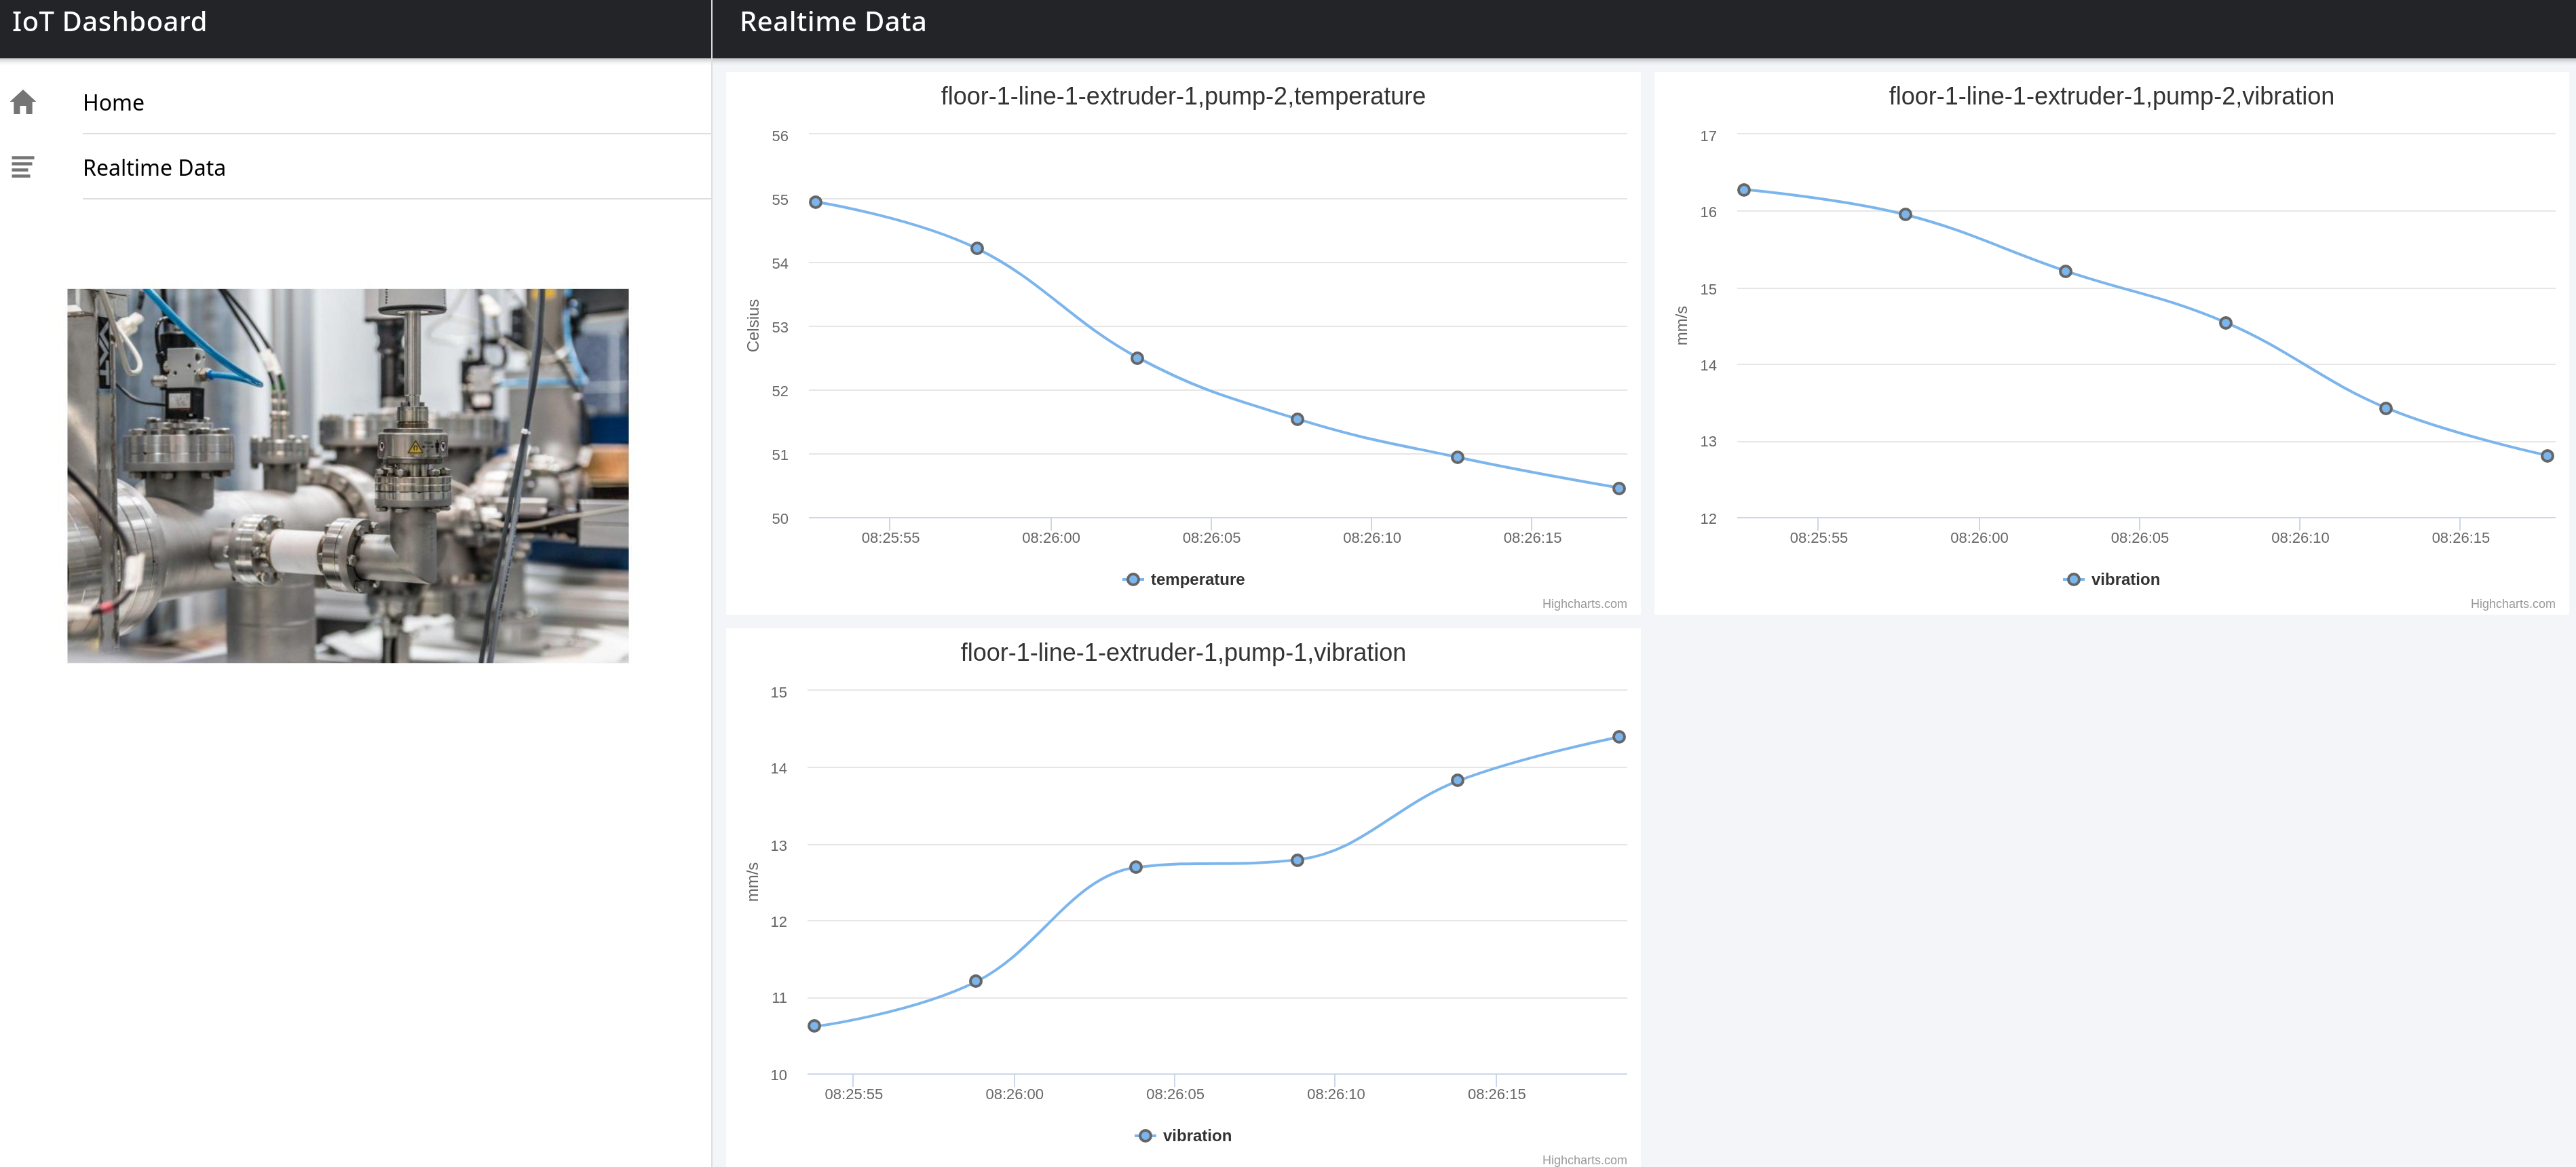
line-dashboard. This will launch the line-dashboard monitoring application in a browser tab. The URL will look like:line-dashboard-manuela-tst-all.apps.*cluster-name*.*domain*Once the application is open in your browser, click the Realtime Data navigation on the left and wait a bit. Data should be visualized as received.
Note: There is only vibration data shown! If you wait a bit more (usually every 2-3 minutes), you will see an anomaly and alert on it.
Now turn on the temperature sensor. Log in using the
gitea_adminusername and the autogenerated password. This password is stored in thegitea-admin-secretsecret located in thevp-giteanamespace. To retrieve it:4.1 Go to Workloads > Secrets in the left-hand menu.
4.2 Using the Projects pull-down, select the
vp-giteaproject and open thegitea-admin-secret.4.3 Copy the password found under Data into the sign in screen located in the nine box Red Hat applications in the OpenShift Container Platform web console.
Note: Alternatively, you can run the following command to obtain the Gitea user’s password automatically:
oc extract -n vp-gitea secret/gitea-admin-secret --to=- --keys=password 2>/dev/nullIn the
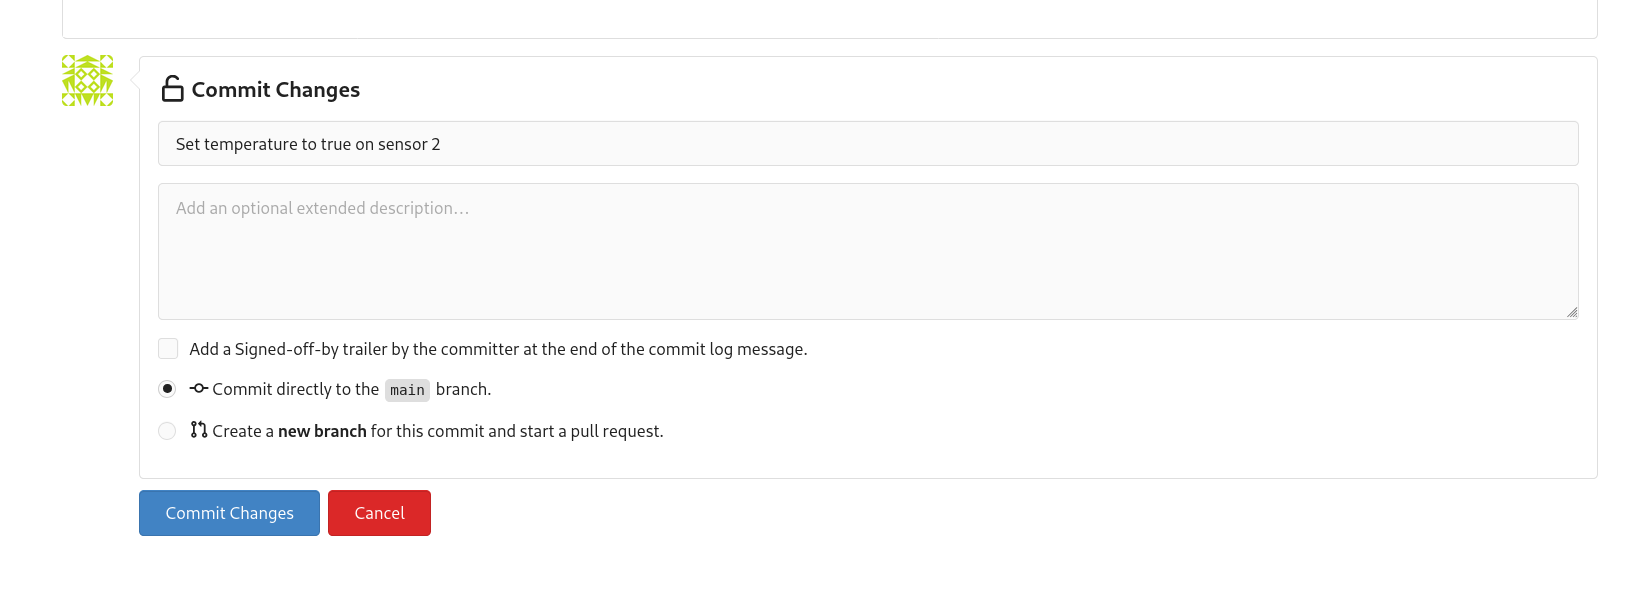
industrial-edgerepository, edit the file calledcharts/datacenter/manuela-tst/templates/machine-sensor/machine-sensor-2-configmap.yamland changeSENSOR_TEMPERATURE_ENABLED: "false"toSENSOR_TEMPERATURE_ENABLED: "true"as shown in the screenshot.Commit this change to your git repository so that the change will be picked up by OpenShift GitOps (ArgoCD).
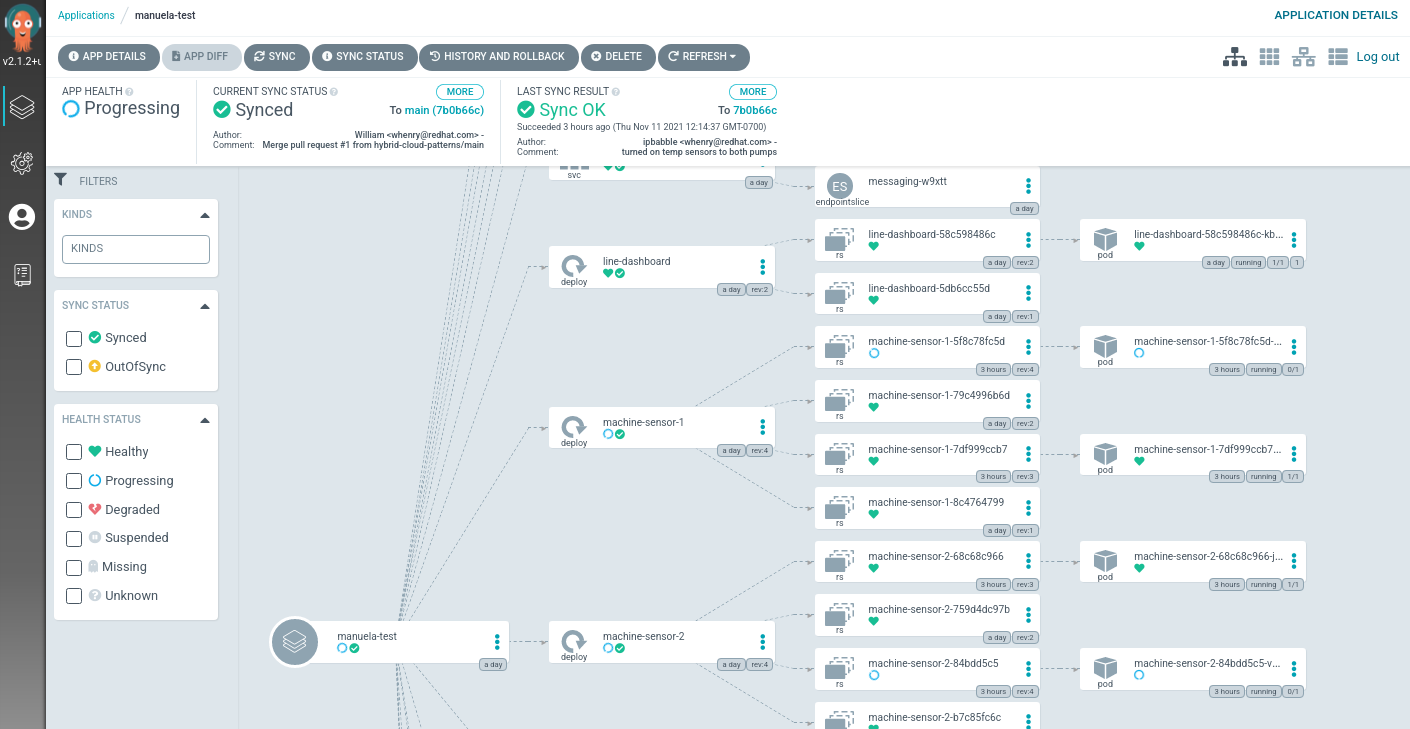
Track the progress of this commit/push in your OpenShift GitOps console in the
manuela-test-allapplication. You will notice components regarding machine-sensor-2 getting sync-ed. You can speed this up by manually pressing theRefreshbutton.The dashboard app should pickup the change automatically, once data from the temperature sensor is received. Sometimes a page/tab refreshed is needed for the change to be picked up.
Adapting the Industrial Edge Pattern for a delivery service use case
This procedure outlines the steps needed to adapt the Industrial Edge pattern for a delivery service use case, while keeping the main architectural components in place.
1. Identify the Core Architecture Components to Reuse
The following components from the Industrial Edge pattern can be reused as is:
- Broker and Kafka components: These will handle streaming data from IoT devices.
2. Develop IoT Sensor Software for Delivery Vehicles
- Create or modify IoT sensor software to be deployed on mobile delivery vehicles.
- Address challenges related to intermittent connectivity, ensuring data can be buffered and sent when a network connection is available.
3. Scale the Solution for a Growing Fleet of Vehicles
- Assess the number of IoT devices required based on fleet size.
- Ensure Kafka and broker components can scale dynamically to handle increased data traffic.
4. Implement AI/ML for Real-Time Data Analysis
- Develop a new AI/ML model to process and analyze telemetry data from IoT devices.
- Train the model to recognize trends in delivery operations, such as route efficiency, fuel consumption, and vehicle health.
5. Define and Configure Kafka Topics for IoT Data
- Create Kafka topics specific to delivery service tracking, such as:
vehicle-locationdelivery-statusfuel-consumptiontemperature-monitoring
- Ensure these topics align with data processing and analytics needs.
6. Deploy and Monitor the Adapted System
- Deploy the updated IoT software on delivery vehicles.
- Monitor data ingestion and processing through Kafka topics and AI/ML insights.
- Scale infrastructure a
Next Steps
What ideas for customization do you have? Can you use this pattern for other use cases? Let us know through our feedback link below.


