$ oc get packagemanifests | grep <operator-name>Understanding the Makefile
The Makefile is the entrypoint for the pattern. We use the Makefile to bootstrap the pattern to the cluster. After the initial bootstrapping of the pattern, the Makefile isn’t required for ongoing operations but can often be useful when needing to make a change to a config within the pattern by running a make upgrade which allows us to refresh the bootstrap resources without having to tear down the pattern or cluster.
About the make install and make deploy commands
Running make install within the pattern application triggers a make deploy from <pattern_directory>/common directory. This initializes the common components of the pattern framework and install a helm chart in the default namespace. At this point, cluster services, such as Red Hat Advanced Cluster Management (RHACM) and Red Hat OpenShift GitOps are deployed.
After components from the common directory are installed, the remaining tasks within the make install target run.
About the make vault-init and make load-secrets commands
The Medical Diagnosis pattern is integrated with HashiCorp Vault and External Secrets Operator services for secrets management within the cluster. These targets install vault from a Helm chart and load the secret (values-secret.yaml) that you created during Getting Started.
If values-secret.yaml does not exist, make will exit with an error saying so. Furthermore, if the values-secret.yaml file does exist but is improperly formatted, Red Hat Ansible Automation Platform exits with an error about being improperly formatted. To verify the format of the secret, see Getting Started.
About the make bootstrap and make upgrade commands
The make bootstrap command is the target used for deploying the application specific components of the pattern. It is the final step in the initial make install target. You might want to consider running the make upgrade command instead of the make bootstrap command directly.
Generally, running the make upgrade command is required when you encounter errors with the application pattern deployment. For instance, if a value was missed and the chart was not rendered correctly, executing make upgrade command after fixing the value would be necessary.
You might want to review the Makefile for the common and Medical Diagnosis components, which are located in common/Makefile and ./Makefile respectively.
Troubleshooting the Pattern Deployment
Occasionally the pattern will encounter issues during the deployment. This can happen for any number of reasons, but most often it is because of either a change within the operator itself or something has changed in the Operator Lifecycle Manager (OLM) which determines which operators are available in the operator catalog. Generally, when an issue occurs with the OLM, the operator is unavailable for installation. To ensure that the operator is in the catalog, run the following command:
When an issue occurs with the operator itself you can verify the status of the subscription and make sure that there are no warnings.An additional option is to log into the OpenShift Console, click on Operators, and check the status of the operator.
Other issues encounter could be with a specific application within the pattern misbehaving. Most of the pattern is deployed into the xraylab-1 namespace. Other components like ODF are deployed into openshift-storage and the OpenShift Serverless Operators are deployed into knative-serving, knative-eventing namespaces.
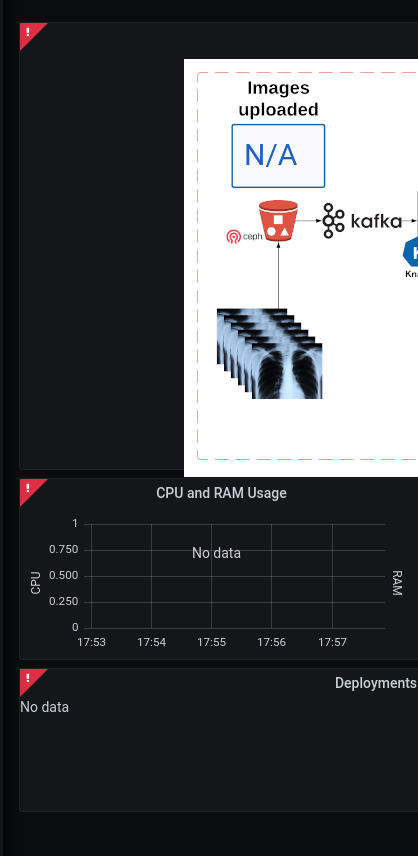
Use the grafana dashboard to assist with debugging and identifying the issue |
- Problem
No information is being processed in the dashboard
- Solution
Most often this is due to the image-generator deploymentConfig needing to be scaled up. The image-generator by design is scaled to 0;
$ oc scale -n xraylab-1 dc/image-generator --replicas=1Alternatively, complete the following steps:
Navigate to the Red Hat OpenShift Container Platform web console, and select Workloads → DeploymentConfigs
Select
image-generatorand scale the pod to 1 or more.
- Problem
When browsing to the xraylab grafana dashboard and there are no images in the right-pane, only a security warning.
- Solution
The certificates for the openshift cluster are untrusted by your system. The easiest way to solve this is to open a browser and go to the s3-rgw route (oc get route -n openshift-storage), then acknowledge and accept the security warning.
- Problem
In the dashboard interface, no metrics data is available.
- Solution
There is likely something wrong with the Prometheus Data Source for the grafana dashboard. You can check the status of the data source by executing the following:
$ oc get grafanadatasources -n xraylab-1Ensure that the Prometheus data source exists and that the status is available. This could potentially be the token from the service account, for example, grafana-serviceaccount, that is provided to the data source as a bearer token.
- Problem
The dashboard is showing red in the corners of the dashboard panes.
- Solution
This is most likely due to the xraylab database not being available or misconfigured. Please check the database and ensure that it is functioning properly.
Ensure that the database is populated with the correct tables:
$ oc exec -it xraylabdb-1-<uuid> bash
$ mysql -u root

USE xraylabdb;

SHOW tables;
Example outputWelcome to the MariaDB monitor. Commands end with ; or \g. Your MariaDB connection id is 75 Server version: 10.3.32-MariaDB MariaDB Server Copyright (c) 2000, 2018, Oracle, MariaDB Corporation Ab and others. Type 'help;' or '\h' for help. Type '\c' to clear the current input statement. MariaDB [(none)]> USE xraylabdb; Database changed MariaDB [xraylabdb]> show tables; +---------------------+ | Tables_in_xraylabdb | +---------------------+ | images_anonymized | | images_processed | | images_uploaded | +---------------------+ 3 rows in set (0.000 sec)Verify the password set in the
values-secret.yamlis working$ oc exec -it xraylabdb-1-<uuid> bash $ mysql -u xraylab -D xraylabdb -h xraylabdb -p <provide_your_password_at_prompt>If you are able to successfully login then your password has been configured correctly in vault, the external secrets operator and mounted to the database correctly.
- Problem
The image-generator is scaled correctly, but the dashboard is not updating.
- Solution
The serverless eventing function might not be able to fetch the notifications from ODF and therefore, not triggering the knative-serving function to scale up. You may want to check the logs of the
rook-ceph-rgw-ocs-storagecluster-cephobjectstore-a-<podGUID>pod in theopenshift-storagenamespace.$ oc logs -n openshift-storage -f <pod> -c rgwYou should see the
PUTstatement with a status code of200Ensure that the
kafkasource,kafkservice, andkafka topicresources are created:$ oc get -n xraylab-1 kafkasourceExample outputNAME TOPICS BOOTSTRAPSERVERS READY REASON AGE xray-images ["xray-images"] ["xray-cluster-kafka-bootstrap.xraylab-1.svc:9092"] True 23m$ oc get -n xraylab-1 kserviceExample outputNAME URL LATESTCREATED LATESTREADY READY REASON risk-assessment https://risk-assessment-xraylab-1.apps.<SUBDOMAIN> risk-assessment-00001 risk-assessment-00001 True$ oc get -n xraylab-1 kafkatopicsExample outputNAME CLUSTER PARTITIONS REPLICATION FACTOR READY consumer-offsets---84e7a678d08f4bd226872e5cdd4eb527fadc1c6a xray-cluster 50 1 True strimzi-store-topic---effb8e3e057afce1ecf67c3f5d8e4e3ff177fc55 xray-cluster 1 3 True strimzi-topic-operator-kstreams-topic-store-changelog---b75e702040b99be8a9263134de3507fc0cc4017b xray-cluster 1 1 True xray-images xray-cluster 1 1 True